Download
1 / 54
540 likes | 663 Vues
Selected Pictures. GLAST Large Area Telescope: Calibration Unit Beam Test Report. Luca Latronico - INFN on behalf of the beam test team. GLAST Collaboration Meeting Stockholm 8/29/2006. Talk outline. Motivations Milestones The CERN-T9 Run Physics program Data samples and configurations

E N D
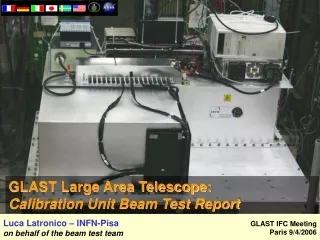
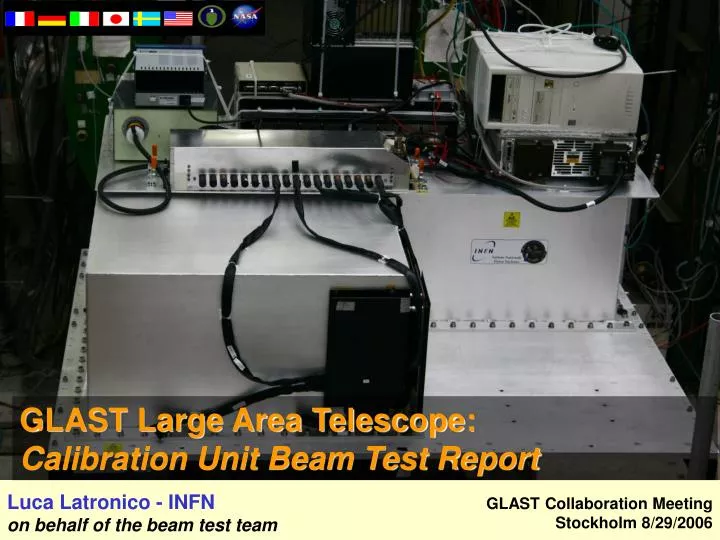
Selected Pictures GLAST Large Area Telescope: Calibration Unit Beam Test Report Luca Latronico - INFN on behalf of the beam test team GLAST Collaboration Meeting Stockholm 8/29/2006
Talk outline • Motivations • Milestones • The CERN-T9 Run • Physics program • Data samples and configurations • Preliminary analysis • CERN-SPS Test status • GSI motivations and status
Calibration Unit Beam test goals • Calibration Unit beam test at CERN (was SLAC) approved by GLAST 2005 Collaboration Meeting • coordinators: R Bellazzini (INFN), E do Couto e Silva (SLAC), B Lott (IN2P3) • Beam request submitted to CERN in october 2005 • Final CERN schedule (delivered 26/6/2006) allocates • 4 weeks at PS/T9 area, 26/7-23/8 • 11 days at SPS/H4 area, 4-15/9 • Goals • build a fraction of the LAT using available flight spare modules (Calibration Unit - CU) • expose CU to variety of beams • tagged photons, electrons, protons, positrons • energies from 100MeV to 300GeV • many different configurations (angle, impact point) • directly measure CU performance • validate full LAT Monte-Carlo simulation
Why test the CU at CERN • Why CERN? • e and hadron beams available • high energy available • past experience (INFN-Bari + AGILE g-tagger at T9, GLAST-CAL at SPS) • optimization of resources with LAT I&T and ramping up to ISOC only if european GLAST members lead CU beam test • H4 line - CERN Prevessin (FR) • Beam extracted from SPS • e, p, p 10-280GeV • clean high E beams available • scheduled 4-15/9 • T9 line - CERN Meyrin (CH) • Beam extracted from PS • e-, p, p 0.5-10GeV • cocktail beams • completed
Motivations for the CU Beam Tests • A CU Beam Test is part of the LAT Calibration Strategy • see LAT-TD-02152 Beam Test Rationale • Sampling (angle, impact point) phase space on the full flight LAT very demanding in cost and schedule • no available beam to irradiate full LAT • Most events on orbit contained in 2 towers • direct calibration with particle beam on a smaller unit is good enough • MonteCarlo techniques and tools have become extremely sophisticated and reliable • The LAT calibration, background rejection strategy and performance parameterization heavily rely on our LAT MonteCarlo • we need to tune our MonteCarlo description against real data taken with the CU • we need to validate the Geant4+Gleam simulation of the relevant physical processes for the LAT
Calibration Unit Beam test Milestones • 10/2005 - coordination group appointed – regular telecons with coordinators to organize activities • L Latronico, D Smith, P Bruel, G Godfrey + required experts • 11/2005 1st VRVS meeting (then bi-weekly on tuesdays), mailing list • 12/2005: roadmap to CU Integration and Test agreed • CU I&T will happen at INFN-Pisa • INFN-Pisa will design and build the CU Inner Shipping Container (ISC) for CU operation at CERN and the CU Outer Shipping Container (OSC) for CU/ISC transportation and storage • LLR takes full responsibility for providing XYq scanning table • 12/2005: transfer of CU hardware to INFN-Pisa initiates • 1/2006: INFN-Bari offer detectors and DAQ for PID for PS and SPS • 2/2006: 1x1 tower I&T completed with CU DAQ • INFN-Pisa will design and build a new MGSE to integrate CAL into grid from the bottom • Online monitoring for CU started at INFN-Pisa
Calibration Unit Beam test Milestones • 3/2006: 1st dedicated CU workshop at INFN-Pisa • ISC, OSC, XYZq Table design agreed • ACD tiles location on ISC agreed • g-tagger silicon detectors from INFN-Trieste • Ancillary Detectors (AD) DAQ from INFN-Bari • Can read g-tagger, cerenkov, scintillators • 0-suppression on si-tagger for faster readout • CU and AD data streams will merge at LDF level online • Offline infrastructure from SLAC (calibration DB, recon pipeline, data monitoring tools) – R Dubois • 1st MC mass production defined • Basic analysis of PSF, Energy Recon, ACD Backsplash presented • 4/2006: CU Flight Hardware handling Plan (LAT-PS-8131) approved • Flight hardware is shipped to INFN for I&T • 4/2006: Flight modules received and tested at INFN-Pisa • 4/2006: Ancillary Systems at INFN-Pisa for data streams merge • 5/2006: CU Integration Procedure and MGSE approved (LAT-PS-8132)
Calibration Unit Beam test Milestones • 5/2006: 2nd dedicated CU workshop at INFN-Pisa • CU Integration complete • PS and SPS experimental setup and basic goals defined • First 2 ACD tiles received and tested • 6/2006: 3rd CU workshop at INFN-Pisa • Final DAQ computer network installed • CU and AD data streams merged online • Online monitor populated with AD plots • All ACD tiles calibrated • Draft schedule of operations presented • 7/2006: CU completion • ISC and OSC proof test (dry-mount+sealing+OSC-free-fall) • CU/ISC Integration and final system test • CU/ISC integration with OSC and transportation to CERN • 7/25/2006: operations start at T9/PS
The GLAST-LAT Calibration Unit • 2.5 towers, ~1/8 of the LAT • 110k Si strip • 288 CsI logs TKR 8 TKR 16 tower 1 tower 2 tower 3 bay 0 CAL 101 CAL 109 CAL 119 CU integration completed at INFN-Pisa may 19 2006
Arrival of hardware to CERN T9 barrack XYZq table CU OSC
The CU in the T9 test area The CU in the T9 test area • CU/ISC (750Kg) installation + integration with XYZq Table completed in 10 hours (from entrance to CERN to final cabling and 1st data) • CU functional verification (CI test) after transportation immediately cleared • Test runs with beam in self-trigger within few hours CU g-tagger 2nd arm Beam dump Spectral magnet g-tagger 1st arm
+ upstream cerenkov to select e or hadrons T9 Setup T9 Experimental Setup
Very first e events from the online CU VME GASU TRGbox FREE 28V PS ISC ACD XYq Table 7/25/2006
The T9-PS Run • Collaboration effort for the T9 run • 50 worked at T9 • Very dedicated and excited for a 24/7 experiment • All collaboration represented at CERN (IT,FR,US,SW,JP) • Support from home institutions during data analysis • Valuable experience for ISOC • Online and data synchronization: L Baldini • MC simulations: F Longo • Pipeline and recon management: Longo, Kuss, Omodei • Local Offline: L Rochester (Socket Gleam), INFN-PG (offline monitor) • TKR analysis: C Cecchi • CAL analysis: P Bruel • ACD analysis: E Charles • Run coordinator: L Latronico • CU installation: A Brez • XYZq Table: P Bruel • CU DAQ: R Claus • Trigger and ancillary detectors: N Mazziotta • Ancillary DAQ: F Gargano • Gamma-Tagger calibration: A Brez, L Baldini
The original Beam Test Plan • After beam time reduction due to CERN problems we had to • Reduce number of angle and impact points • Add full-brem g data collection to quickly cover full spectrum (G Godfrey) • Proceed with caution and first complete all data sets (g,e,e+,p) with fewer configurations and statistics and only at the end explore phase space more • Eventually it worked very well and managed to cover unforeseen configuration (e.g. Albedo g)
CERN Beam Structure SPILL Particles ~400ms • We do not have continous beam • CERN manages many users and accelerators • Large fraction of the cycle w/o particles • AD data transfer and data merge OFF-spill • CU DAQ peak rate much higher than average • 4th spill is a 25% duty cycle increase and allowed us to complete the program SPS SUPER CYCLE 16.8s 3 or 4 SPILL per CYCLE Intensity Working hours cycle Non-Working hours cycle
CU g DUMP e S4 Tag 2-3 magnet e Tag 0-1 Sfront Photon data overview • Full-bremsstrahlung • Trigger on Sfront only (+cerenkov) • No AD DAQ KHz readout rate • Full brem spectrum from 2.5GeV e • Rely on nominal beam position, G4 bremstrahlung spectrum, estimated radiator material • Tagged photon • Trigger on S4&Sfront (+cerenkov) • Synchronized with AD DAQ O(100)Hz rate • Record limited slice of spectrum but provide single g energy and incoming direction
Photon data overview - configurations + 2 albedo configurations shooting upwards g at different angle, position
First comparison of g data with MC Full-brem data CAL log E deposit Full-brem data angular distribution Lott within few hours from raw data, thanks to MC, recon, pipeline!
Gamma tagger operation and calibration • Tagger operation • Keep geometry fixed to avoid recalibration • Scan g spectrum using several combinations of beam and bending power (constant E/BL) • Geometry only modified at the end of the test to improve resolution for low energy g • Lowest E, max BL • Tagger calibration – performed in 6 hours • Alignment • First tagger arm aligned with direct beam • Second arm with direct beam and magnet ON • Bending power (BL) • calibrated scanning spectral magnet current vs beam deflection measured from first tagger arm to CU • Multiple Scattering (MS) • From tracks opening in non-bending plane • Beam momentum dispersion Dp/p • calculated deconvolving MS from overall tagger resolution Brez, Baldini, Sgro, Bregeon
2.5GeV e beam Tagger: standard configuration • Tagger resolution worse at lower E • Scales as 1/BL (we scaled magnet to preserve geometry) • ~1.4 % @ 0.7 T*m (max bending power) • Larger beam divergence and momentum spread • Larger MS • For 500MeV the acceptance cut into unradiated beam • Some empty events in the CU (no g) • More statistics required 0.5GeV e beam • e energy (tagger) • g energy (CU) • sum Brez, Baldini, Sgro, Bregeon
Comparison with tagger data • Tagged g analysis: incoming g direction from tagger and error from resolution • Full-brem g analysis: average beam line and dispersion assumed • Can benefit from large statisics and acceptance of full-brem data g at 0° through twr3 preliminary Cecchi, Germani, Pepe
Point Spread Function with tagged g • Performance and systematic effects of the beam and tagger must be fully understood and transferred to analysis • Beam dispersion • Double photons from extra material • MC data must be tuned and above effects included or controlled with proper cuts preliminary preliminary TkrNumTracks=1||2 Cecchi, Germani, Pepe
Energy Resolution preliminary Bruel
Geometry optimized for Low E 500 MeV beam, 480 A -> ~100 MeV g Geometry optimized for Very Low E 500 MeV beam, 525 A -> ~ 80 MeV g Tagger: low energy setup • e energy (tagger) • g energy (CU) • sum • Higher energy resolution available for low energy gammas • Calibration runs analysis only preliminary (larger MS) • Crucial for CU studies at low energy Brez, Baldini, Sgro, Bregeon
Photon beam dispersion • Circular beam spot (1 cm radius) selected on the first layer of the tagger • Red ellipse is the beam spot projected to the CU, taking into account the e beam divergence in the two directions (as measured by the tagger) • Data points are g vertex positions • Experimentally seen as beam dump was cutting g beam when working at 500MeV e • Must take this into account for analysis 500 MeV 1000 MeV 1500 MeV 2500 MeV Brez, Baldini, Sgro, Bregeon
Double gammas in the CU From VLE tagged-g Could see these in real-time using Socket-Gleam
More photons p sneaking dump g
CU Positron runs – setup I • first set of data with simplified setup • Magnet ON and extended dump to stop brem g from e+ • Just shoot 1M e+ through MMS placed in front of ACD side top tile (to increase path length in tracker) • Also shoot 1M e for comparison • Rely on ACD side veto power • Require tracking to • Identify exact MMS target position • Identify ACD cracks (see plot) • Find double photon events from annihilation magnet dump 4 layers MMS
CU Positron runs – setup II • second set of data with modified setup • Magnet ON and extended dump to stop brem g from e+ • Finger counters in front of CU to trigger on fiducial volume centerd on annihilator • Collect 1M e+ and 1M e • Rely on ACD top tile veto power • Ongoing analysis and MC simulations (Mizuno, Funk) magnet dump finger counters in coincidence with upstream counters
CU Proton runs • Collected 5M protons at 10, 6 GeV, several angle • Small angle and through MMS target • 30°, 60° and 90° for background study and hadronic interactions modeling in the CAL • Have to live with few % K contamination, while p are rejected by veto on cerenkov • Collected high rate data, external trigger • LATTE peak rate over 4KHz • Pipeline test too • Running ancillary in parallel to monitor beam stability • Issues • Some runs taken with ACD OFF • CAL pedestal drift due to high rate of energy deposition in logs
Proton Runs • Analysis must take this effect into account • reduce statistics cutting on start of spill • correct offline based on Dt and deposited E (Berrie)
DAQ: Beam Test Data-taking Experiences • Standard data-taking with external trigger • Sporadic CU DAQ crash experienced • malformed TKR phasing error contribution (R Claus + E. Siskind) • LDF parser (v06-02-01) modified to not parse pathological contributions • No crashes after modification • Sporadic loss of synchronization between CU and AD DAQ • Mainly due to operator mistakes or hardware instabilities (AD timestamp cable) • Catched in real-time by Online monitor and runs immediately stopped • High rate (KHz) standalone CU with internal trigger + high occupancy • More than the usual rate of TKR FIFO Full errors wrt LAT experience • Set point at which GTCC Data FIFO Almost Full condition comes on from 75% to 52% (E. Siskind): Rate is now acceptable • May need to revisit this, along with the GTRC buffer sizes, for SPS running where higher TKR occupancy is expected • High rate of “Packet errors” (truncation errors) • mismatch between flight model EBM (GASU) and EM TEMs: Not an issue for flight • Such contributions are ignored by analyses since as are not decodable R Claus
H4-SPS Test status • CU and electronics already in H4 since end of T9 run • Installation starting next Monday 9/4 – everything ready • 9 days for data taking until 9/15 (2 days MD) • Clean high energy beams promised • Simple setup • No ancillary detectors other than trigger plastics and cerenkov for hadron beam (p/p discrimination) • Same crew with Benoit Lott run coordinator • Focus on • High energy EM shower • High occupancy in TKR • ACD backsplash CU S1 S2 C1 C2 SPS-H4 setup e-, p , p 10-300GeV
CU Beam Test at GSI - Motivations • Motivations • TKR response to relativistic heavy ions • TKR never tested with heavy ions • Spice simulations (R. Johnson) show that a heavy ion signal can saturate a strip amplifier, thus making the strip and few neighboring inactive for ms, and the layer trigger OR inactive for more than 100ms • CAL response to relativistic heavy ions • verification of the publihsed CAL GSI beam test results with a flight unit • Verify CNO operation for CAL on-orbit calibration • ACD CNO triggering • TKR to track ion path to CAL • CAL calibration
CU Beam Test at GSI - Status • Requirements – minimal from now • No integration work on the CU • No need for ancillary detectors • primary pure ion beam (C), well defined in energy and spot • No further DAQ development • No further offline infrastructure required • External trigger plastic scintillators • Estimated resources - 12FTE for 7 days • core team of experts for installation, 2 days of run, dismantling • Status – ready to commit • CU test already in the GSI schedule for mid November • good relationship with lab from previous run, crucial to guarantee success in a 2 days run • INFN plan to visit GSI in october to verify installation of CU, scanning table and trigger detectors in the cave • CU will travel back to INFN-Pisa after SPS • same people responsible for storage and test
Conclusions .... so far • First beam test completed • Program completed (despite time lost for CERN problems) • High quality and high statistics data • g in 100MeV-2.5GeV range (tagged+untagged) • e at 1,2.5, 5GeV • e+ at 1GeV • p at 6,10GeV • many CU configurations • High energy e and p next week – setup and people ready • Preliminary analysis show very good agreement between data and MC and measured performances in agreement with the specs • Plan to be busy with analysis for 6-12 months GLAST land at CERN – summer 2006
Tagger: standard configuration • e energy (tagger) • g energy (CU) • sum 1GeV 0.5GeV primary e beam 2.5GeV 1.5GeV Brez, Baldini, Sgro, Bregeon
Tagger (+ beam) resolution • Electron energy resolution fixed for fixed bending power (bending angle and multiple scattering have the same dependence on energy) ~1.4 % @ 0.7 T*m including the beam dispersion. • For fixed geometry, the energy resolution scales as expected with the bending power. 0.27 T*m 0.40 T*m 0.48 T*m 0.71 T*m Brez, Baldini, Sgro, Bregeon
Tagger calibration • The multiple scattering measurement (from tracks angle in non-bending plane) allow to decouple the tagger resolution from the beam dispersion. Brez, Baldini, Sgro, Bregeon
Photon data configurations • CU positions • Twr2: 0, 30, 50 deg • Twr3: 0, 10, 20, 30 , 50 deg • Full-brem: 800k g 0-2.5GeV • Tagged: 100K g 0-1.5GeV • Albedo 145 degrees deep in CAL • ACD tile moved on twr 3 side to simulate LAT response to such photons • Full-brem: 800k g 0-2.5GeV • Tagged: 100k g 500-800MeV, 25k 100-300MeV • Albedo 215 degrees above CAL • Full-brem: 800k g 0-2.5GeV
Double gammas in the CU MC data D Paneque
Electron runs • First 5GeV scan affected by p pileup • Second 5GeV scan has more positions, minimized pileup, correct CU timing, new CAL calibration constant and better beam definition – analysis in progress (Bruel)
Special Runs • CAL FHE scan • 5GeV e at 0 and 60 degrees with FHE thresholds from 500MeV to 2000MeV • Random trigger for direct pileup measurement in full-brem mode • CU configurations as in full-brem runs
DAQ: Beam Test Data-taking Experiences • High rate standalone CU with internal trigger (KHz trigger rates, high occupancy) • One run with all events having cable phasing errors (700000611) • Unexplained issue seen only once (despite initial reports) • Appears to be a start-up problem: possibly power on sequence wasn’t properly followed or it was the consequence of the previous run’s crash (see below) • More than the usual rate of TKR FIFO Full errors wrt LAT experience • Set point at which GTCC Data FIFO Almost Full condition comes on from 75% to 52% (E. Siskind): Rate is now acceptable • May need to revisit this, along with the GTRC buffer sizes, for SPS running where higher TKR occupancy is expected • High rate of “Packet errors” (truncation errors) • Due to flow control model mismatch between flight model EBM (GASU) and EM TEMs: Not an issue for flight • Contributions with these errors are ignored by analyses since they are not decodable