Download
1 / 29
300 likes | 332 Vues
Classification of Microarray Data. The DNA Array Analysis Pipeline. Question Experimental Design. Array design Probe design. Sample Preparation Hybridization. Buy Chip/Array. Image analysis. Normalization. Expression Index Calculation. Comparable Gene Expression Data.

E N D
The DNA Array Analysis Pipeline Question Experimental Design Array design Probe design Sample Preparation Hybridization Buy Chip/Array Image analysis Normalization Expression Index Calculation Comparable Gene Expression Data Statistical Analysis Fit to Model (time series) Advanced Data Analysis Clustering PCA Classification Promoter Analysis Meta analysis Survival analysis Regulatory Network
Outline • Example: Childhood leukemia • Classification • Method selection • Feature selection • Cross-validation • Training and testing • Example continued: Results from a leukemia study
Childhood Leukemia • Cancer in the cells of the immune system • Approx. 35 new cases in Denmark every year • 50 years ago – all patients died • Today – approx. 78% are cured • Risk groups: • Standard, Intermediate, High, Very high, Extra high • Treatment • Chemotherapy • Bone marrow transplantation • Radiation
Risk Classification Today Patient: Clinical data Immuno-phenotype Morphology Genetic measurements Prognostic factors: Immunophenotype Age Leukocyte count Number of chromosomes Translocations Treatment response Risk group: Standard Intermediate High Very high Extra High Microarray technology
Study of Childhood Leukemia • Diagnostic bone marrow samples from leukemia patients • Platform: Affymetrix Focus Array • 8793 human genes • Immunophenotype • 18 patients with precursor B immunophenotype • 17 patients with T immunophenotype • Outcome 5 years from diagnosis • 11 patients with relapse • 18 patients in complete remission
Reduction of data • Dimension reduction • PCA • Feature selection (gene selection) • Significant genes: t-test • Selection of a limited number of genes
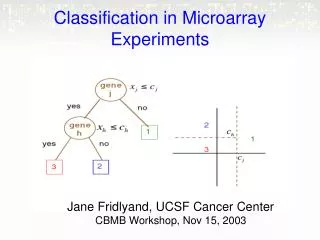
Linear discriminant analysis • Assumptions: • Data e.g.. Gaussian distributed • Variance and covariance the same for all classes • Calculation of class probability
Nearest Centroid • Calculation of a centroid for each class • Calculation of the distance between a test sample and each class centroid • Class prediction by the nearest centroid method
K-Nearest Neighbor • Based on distance measure • For example Euclidian distance • Parameter k = number of nearest neighbors • k=1 • k=3 • k=... • Always an odd number • Prediction by majority vote
Support Vector Machines • Machine learning • Relatively new and highly theoretic • Works on non-linearly separable data • Finding a hyperplane between the two classes by minimizing of the distance between the hyperplane and closest points
Neural Networks Gene1 Gene2 Gene3 ... B T
Cross-validation Given data with 100 samples Cross-5-validation: Training: 4/5 of data (80 samples) Testing: 1/5 of data (20 samples) - 5 different models and performance results Leave-one-out cross-validation (LOOCV) Training: 99/100 of data (99 samples) Testing: 1/100 of data (1 sample) - 100 different models
Validation • Definition of • True and False positives • True and False negatives Actual class B B T T Predicted class B T T B TP FN TN FP
Sensitivity and Specificity Sensitivity: the ability to detect "true positives" TP TP + FN Specificity: the ability to avoid "false positives" TN TN + FP Positive Predictive Value (PPV) TP TP + FP
Accuracy • Definition: TP + TN TP + TN + FP + FN • Range: [0 … 1]
Matthews correlation coefficient • Definition: TP·TN - FN·FP √(TN+FN)(TN+FP)(TP+FN)(TP+FP) • Range: [-1 … 1]
Testing of classifier Independent test set Overview of Classification Expression data Subdivision of data for cross-validation into training sets and test sets Feature selection (t-test) Dimension reduction (PCA) • Training of classifier: • using cross-validation • choice of method • - choice of optimal parameters
Important Points • Avoid over fitting • Validate performance • Test on an independent test set • Use cross-validation • Include feature selection in cross-validation Why? • To avoid overestimation of performance! • To make a general classifier
Multiclass classification • Same prediction methods • Multiclass prediction often implemented • Often bad performance • Solution • Division in small binary (2-class) problems
Study of Childhood Leukemia: Results • Classification of immunophenotype (precursorB and T) • 100% accuracy • During the training • When testing on an independent test set • Simple classification methods applied • K-nearest neighbor • Nearest centroid • Classification of outcome (relapse or remission) • 78% accuracy (CC = 0.59) • Simple and advanced classification methods applied
Summary • When do we use classification? • Reduction of dimension often necessary • T-test, PCA • Methods • K nearest neighbor • Nearest centroid • Support vector machines • Neural networks • Validation • Cross-validation • Accuracy and correlation coefficient
Coffee break Next: Exercise
Risk classification in the future ? Patient: Clincal data Immunopheno-typing Morphology Genetic measurements Prognostic factors: Immunophenotype Age Leukocyte count Number of chromosomes Translocations Treatment response Risk group: Standard Intermediate High Very high Ekstra high Microarray technology Customized treatment