Download
1 / 40
400 likes | 521 Vues
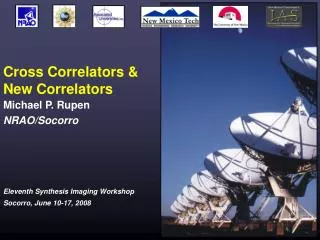
Cross Correlators. Michael P. Rupen NRAO/Socorro. What is a Correlator?. In an optical telescope… a lens or a mirror collects the light & brings it to a focus a spectrograph separates the different frequencies.

E N D
Cross Correlators Michael P. Rupen NRAO/Socorro M.P. Rupen, Synthesis Imaging Summer School, 18 June 2002
What is a Correlator? • In an optical telescope… • a lens or a mirror collects the light & brings it to a focus • a spectrograph separates the different frequencies M.P. Rupen, Synthesis Imaging Summer School, 18 June 2002
In an interferometer, the correlator performs both these tasks, by correlating the signals from each telescope (antenna) pair: M.P. Rupen, Synthesis Imaging Summer School, 18 June 2002
The basic observables are the complex visibilities: • amplitude & phase • as functions of • baseline, time, and frequency. • The correlator takes in the signals from the individual telescopes, and writes out these visibilities. M.P. Rupen, Synthesis Imaging Summer School, 18 June 2002
The cross-correlation of two real signals and is Correlator Basics A simple (real) correlator. M.P. Rupen, Synthesis Imaging Summer School, 18 June 2002
Antenna 1: M.P. Rupen, Synthesis Imaging Summer School, 18 June 2002
Antenna 2: M.P. Rupen, Synthesis Imaging Summer School, 18 June 2002
=0: M.P. Rupen, Synthesis Imaging Summer School, 18 June 2002
=0.5: M.P. Rupen, Synthesis Imaging Summer School, 18 June 2002
=1: M.P. Rupen, Synthesis Imaging Summer School, 18 June 2002
=1.5: M.P. Rupen, Synthesis Imaging Summer School, 18 June 2002
=2: M.P. Rupen, Synthesis Imaging Summer School, 18 June 2002
Correlation: M.P. Rupen, Synthesis Imaging Summer School, 18 June 2002
So we need only measure with Correlation of a Single Frequency For a monochromatic signal: and the correlation function is M.P. Rupen, Synthesis Imaging Summer School, 18 June 2002
xI xR Correlation: M.P. Rupen, Synthesis Imaging Summer School, 18 June 2002
At a given frequency, all we can know about the signal is contained in two numbers: the real and the imaginary part, or the amplitude and the phase. A complex correlator. M.P. Rupen, Synthesis Imaging Summer School, 18 June 2002
The simple approach: • use a filterbank to split the signal up into quasi-monochromatic signals • hook each of these up to a different complex correlator, with the appropriate (different) delay: • add up all the outputs • The clever approach: • instead of sticking in a delay, put in a filter that shifts the phase for all frequencies by /2 Broad-band Continuum Correlators M.P. Rupen, Synthesis Imaging Summer School, 18 June 2002
The simple approach: • use a filterbank to split the signal up into quasi-monochromatic signals • hook each of these up to a different complex correlator, with the appropriate (different) delay: • record all the outputs: Spectral Line Correlators M.P. Rupen, Synthesis Imaging Summer School, 18 June 2002
The frequency spectrum is the Fourier transform of the cross-correlation (lag) function. • Short lags (small delays) high frequencies • Long lags (large delays) low frequencies • …so measuring a range of lags corresponds to measuring a range of frequencies! Fourier Transforms: a motivational exercise M.P. Rupen, Synthesis Imaging Summer School, 18 June 2002
Spectral Line Correlators (cont’d) • Clever approach #1: the FX correlator • F: replace the filterbank with a Fourier transform • X: use the simple (complex) correlator above to measure the cross-correlation at each frequency • average over time, & record the results • 3. Clever approach #2: the XF correlator • X: measure the correlation function at a bunch of different lags (delays) • average over time • F: Fourier transform the resulting time (lag) series to obtain spectra • record the results M.P. Rupen, Synthesis Imaging Summer School, 18 June 2002
F v1 S1() v2 S2() Fourier transform t X X multiply multiply Fourier transform S() t F FX vs. XF M.P. Rupen, Synthesis Imaging Summer School, 18 June 2002
Fig. 4-6: FX correlator baseline processing. Fig. 4-1: Lag (XF) correlator baseline processing. M.P. Rupen, Synthesis Imaging Summer School, 18 June 2002
Details, Details • Why digital? • precise & repeatable • lots of duplication • accurate & stable delay lines • …but there are some complications as well… M.P. Rupen, Synthesis Imaging Summer School, 18 June 2002
Digitization • Sampling:v(t)v(tk), with tk=(0,1,2,…)t • For signal v(t) limited to 0, this is lossless if done at the Nyquist rate: t1/(2) • n.b. wider bandwidth finer time samples! • limits accuracy of delays/lags • Quantization:v(t)v(t) + t • quantization noise • quantized signal is not band-limited oversampling helps M.P. Rupen, Synthesis Imaging Summer School, 18 June 2002
Quantization & Quantization Losses M.P. Rupen, Synthesis Imaging Summer School, 18 June 2002
V1 0.3 V2 integrated & normalized Signals come in… sampled… quantized… delayed… multiplied… Michael’s Miniature Correlator M.P. Rupen, Synthesis Imaging Summer School, 18 June 2002
Cross-Correlating a Digital Signal • We measure the cross-correlation of the digitized (rather than the original) signals. • digitized CC is monotonic function of original CC • 1-bit (2-level) quantization: • is average signal power level – NOT kept for 2-level quantization! • roughly linear for correlation coefficient • For high correlation coefficients, requires non-linear correction: the Van Vleck correction M.P. Rupen, Synthesis Imaging Summer School, 18 June 2002
Van Vleck Correction M.P. Rupen, Synthesis Imaging Summer School, 18 June 2002
Spectral Response; Gibbs Ringing • XF correlator: limited number of lags N ‘uniform’ coverage to max. lag Nt Fourier transform gives spectral response - 22% sidelobes! - Hanning smoothing • FX correlator:as XF, but Fourier transform before multiplication spectral response is • - 5% sidelobes M.P. Rupen, Synthesis Imaging Summer School, 18 June 2002
Spectral Response: XF Correlator M.P. Rupen, Synthesis Imaging Summer School, 18 June 2002
sinc( ) vs. sinc2( ) M.P. Rupen, Synthesis Imaging Summer School, 18 June 2002
n.b.radio frequency interference is spread across frequency by the spectral response Gibbs phenomenon: ‘ringing’ off the band edges M.P. Rupen, Synthesis Imaging Summer School, 18 June 2002
How to Obtain Finer Frequency Resolution • The size of a correlator (number of chips, speed, etc.) is generally set by the number of baselines and the maximum total bandwidth.[note also copper/connectivity costs…] • Subarrays • … trade antennas for channels • Bandwidth • -- cut : • same number of lags/spectral points across a smaller : Nchan= constant • narrower channels: • …limited by filters M.P. Rupen, Synthesis Imaging Summer School, 18 June 2002
-- recirculation: • chips are generally running flat-out for max. (e.g. EVLA/WIDAR uses a 256 MHz clock with = 128 MHz/sub-band) • For smaller , chips are sitting idle most of the time: e.g., pass 32 MHz to a chip capable of doing 128 M multiplies per second • add some memory, and send two copies of the data with different delays • Nchan 1/ • 2 …limited by memory & data output rates M.P. Rupen, Synthesis Imaging Summer School, 18 June 2002
VLA Correlator: Bandwidths and Numbers of Channels M.P. Rupen, Synthesis Imaging Summer School, 18 June 2002
VLBI • difficult to send the data to a central location in real time • long baselines, unsynchronized clocks relative phases and delays are poorly known • So, record the data and correlate later • Advantages of 2-level recording M.P. Rupen, Synthesis Imaging Summer School, 18 June 2002
Correlator Efficiency c • quantization noise • overhead • don’t correlate all possible lags • blanking • errors • incorrect quantization levels • incorrect delays M.P. Rupen, Synthesis Imaging Summer School, 18 June 2002
Choice of Architecture • number of multiplies: FX wins as {Nant, Nchan} multiplies per second ~ Nant2 Nprod Nchan • number of logic gates: XF multiplies are much easier than FX; which wins, depends on current technology • shuffling the data about: “copper” favors XF over FX for big correlators • bright ideas help: hybrid correlators, nifty correlator chips, etc. M.P. Rupen, Synthesis Imaging Summer School, 18 June 2002
New Mexico Correlators M.P. Rupen, Synthesis Imaging Summer School, 18 June 2002
Current VLA EVLA/WIDAR M.P. Rupen, Synthesis Imaging Summer School, 18 June 2002