Download
1 / 36
360 likes | 458 Vues
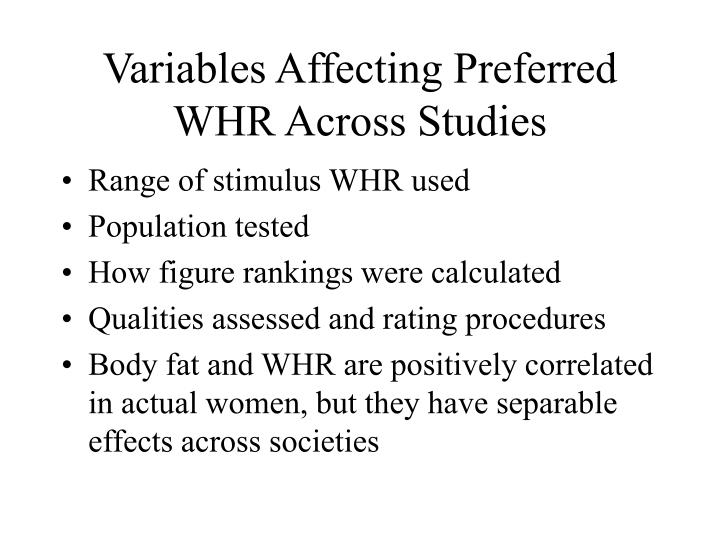
Variables Affecting Preferred WHR Across Studies. Range of stimulus WHR used Population tested How figure rankings were calculated Qualities assessed and rating procedures Body fat and WHR are positively correlated in actual women, but they have separable effects across societies.

E N D
Variables Affecting Preferred WHR Across Studies • Range of stimulus WHR used • Population tested • How figure rankings were calculated • Qualities assessed and rating procedures • Body fat and WHR are positively correlated in actual women, but they have separable effects across societies
We’re Special! • Complex adaptations generally expected to be species-typical (e.g., Tooby & Cosmides, 1992) • But, humans have greater within-species habitat variability than other species
Foragers • Forager societies: high fecundity, parasite loads, caloric dependence on fibrous foods • All increase WHR • Factors vary across culture and across ancestral populations
Lawrence S. Sugiyama • Dept. Anthropology, University of Oregon • Evolutionary psychologist, human behavioral ecologist, and cultural anthropologist • South American forager societies
Ancestral Forager Populations • Normal WHR probably higher than in modern Western population • Locally “low” WHR would vary across populations (local diets, environments) • Average WHR of nubile females and females at peak fertility would vary • Ability to digest large quantities of fibrous food or large masses of game (would increase WHR by altering stomach extension) advantageous in some ancestral environments
Continued…. • WHRs indicative of puberty, fertility, and hormonal irregularities may differ across populations • Environmental fluctuations could change relationship b/t RV cues and body morphology within a lifetime
Conclusion Is: • Assessment needs to be calibrated to local parameters • Body fat, skin tone, facial features, height preferences, etc. • Should expect WHR preference mechanisms to assess local distribution of female WHR in relation to other correlates of mate value, and readjust as conditions change
By Way of Example • Woman with low body fat (cue for low mate value) may also have low WHR (cue for high mate value) due to pelvic girdle width • Woman with higher body fat may have higher WHR • Women with identical WHRs who differ in height won’t produce the same attractiveness assessment
Good Adaptive Design • Should weight individual components • Factor them together for overall assessment of attractiveness • At the least, should be sensitive to observed range of female WHR and body fat in relation to other aspects of body structure • Ideally, the assessments would be cross-correlated with other evaluation of other mate-value cues (e.g., skin tone, activity level, breast development, hair luster, FA, etc.) • Compute local WHR the provides most reliable cue to sex, health, and reproductive status
Local Preference • Multiple cues for evaluation • Those of greatest local relevance weighted/valued more heavily • One preference criterion could override others
vis-à-vis WHR • Shouldn’t expect uniform cross-cultural preference • Should expect values: • Lower than local average will be attractive • Values distinguishing female from male will be attractive
Sugiyama (2004) • Matsiguenka and Hadza studies show WHR variation • Apply context-sensitive WHR-assessment hypothesis
Study Society • Tested male use of WHR in attractiveness judgments among Shiwiar of Ecuadorian Upper Amazon • Shiwiar in study villages rarely have direct day-to-day contact with outsiders • Foragers and simple agriculture • Preference for high female weight/fat (within local range) is expressed by men and linked to health and fertility
Shiwiar Female WHRs • Measured WHR of 56 Shiwiar females, 44 males • As predicted, female WHR higher (0.81-1.02; average = 0.87) than for industrialized societies • Shiwiar females 12 years and older have significantly lower WHR than men and females 11 years and younger
Study 1 • Men shown Singh’s 12 figures • Asked to select the most, second most, second least, and least for attractiveness, health, sexual desirability, fertility, youthfulness, quality as mother, and quality as wife
Results • Only high weight figures chosen as healthy, sexy, wife • Only low weight figures chosen as least healthy • Overweight figures were chosen as most attractive, sexually attractive, best wife and mother • Underweight figures were chose as least attractive and worst mother • Contrary to WHR hypothesis, there were no demonstrable effects of WHR on the assessments
Study 2 • Is high body fat preference overriding influences of WHR? • Are preferences calibrated to local WHR? • Presented stimulus figures separately by weight group • Men shown 4 figures with WHR of 0.7, 0.8, 0.9, 1.0; asked to identify most and least attractive • Presented separately for low, normal, and overweight figure sets
Results • Classified WHR as low (0.7, 0.8) or medium-high (0.9, 1.0) based on Shiwiar female average • Low WHR figures were now rated significantly above high WHR figures on sexual desirability, fertility, health, youthfulness, and best mother
Meaning… • Implies Shiwiar males use female WHR and weight • Consistent with hypotheses that: • Males have evaluative mechanisms for both WHR and body weight • And, WHR assessment is sensitively calibrated to local parameters
And… • Shiwiar males prefer higher body fat females within locally observed levels • If WHR and body fat are not independently assesses, men would prefer high WHR figures because they appear to weigh the most among the high-weight figures • But, when differences in body weight are minimized, they prefer lower than locally average female WHRs
But… • Stimuli not completely unconfounded for body weight and WHR • Also didn’t symmetrically bracket female Shiwiar WHR range (better would be 0.7, 0.8, 0.9 against 1.0, 1.1, 1.2) • Similar problem with Marlowe & Wetsman (2001)
Methodological Corrections • Means that stimuli need to be made after local WHR ranges are known • When high body weight preferred, wide range of WHR and body fat should be included in stimuli figures • Widening waist simultaneously increases figure volume and WHR; narrowing hips decreases figure volume and increases WHR • Better to manipulate body weight & WHR separately
Cont. • Should eliminate other cues to age, reproductive status, or sex • Provide independent cues of mate value • More confounds with weight and WHR • Just showing mid and lower body or maybe figures from behind might be solutions
Nurture? • Re: Yu & Shepard (1998) • “Effects of acculturation and other environmental inputs on perceptions and behavior are mental phenomena to be explained, rather than explanations in and of themselves.” (p. 60)
Body Mass Index (BMI) • Statistical measure comparing weight and height • Does not actually measure percentage of body fat • Developed by Adolphe Quetelet b/t 1830-1850
Late(ish) 20th Century • Popularized by Ancel Keys (1972); for population studies, not individuals • Simplicity has driven its use for individual evaluation • BMI = mass(kg)/(height(m))2 • Emaciated (<15), underweight (15-19), normal (19-25), overweight (25-30), obese (30-35), severely obese (>35)
Problems • For given height, BMI proportional to weight • For given weight, BMI inversely proportional to the square of the height • If all body dimensions double and weight scales naturally with the cube of the height, then BMI doubles instead of staying the same • Taller people will have high BMIs compared to actual body fat levels
Problems • Ignores frame size and muscularity • Also, proportions of fat, bone, cartilage, and water weight • High muscle density means athletes get ranked as overweight/obese • Child and elderly differences in bone density may be ranked as more underweight
Issues re: EP Usage • Simplistic assumptions re: distribution of muscle and bone mass • Overestimates adiposity for lean body people • Romero-Corral et al. (2006) analysis of 40 studies • Overweight at lower risk than normal for CV mortality; obese had no higher risk than normal • Underweight and severely obese did show increased risk • Hunter-gatherers • Usefulness for assessing health?
Tovee et al. (1998) • Anorexic women • Infertile • Can have same WHR as non-anorexics • Perhaps WHR is not best predictor of reproductive fitness • BMI
Method • 40 male undergrads • Rated colour pictures of 50 front view women • 10 pictures from each BMI category • Each woman had different WHR; range: 0.68-0.9 • Heads removed from pictures
Results • Attractiveness ratings significantly explained by BMI and WHR • BMI accounted for 73.5% variance • WHR only 1.8% • Small BMI changes had strong effects on attractiveness; no so for WHR • No effects from WBR (upper body), BHR (hourglass shape), leg/torso length ratio
Tovee & Cornelissen (1999) • Critiquing Yu & Shepard (1998) • Argue BMI is confounded with figures used in WHR studies • Altering width of torso around waist alters both WHR and BMI
Alternate Interpretation • Yu & Shepard found preference for O9 figure in the least westernized group • Choosing least curvaceous shape (high WHR) also results in highest BMI; this would make make BMI strong cue for attractiveness • Maybe results simply represent preference for high BMI in most isolated group
Rebuttle • Yu & Shepard (1999) • Yomybato males ranked figures: O9, O7, N9, N7, U9, U7 • Does agree with BMI hypothesis • But for attractiveness and spouse preference, Shipetiari males ranked figures: O7, O9, N7, N9, U7, U9 • Alto Madre and Americans group by WHR and then weight • Confound here (WHR first, then BMI); doesn’t fit with BMI interpretation