Download
1 / 26
270 likes | 369 Vues
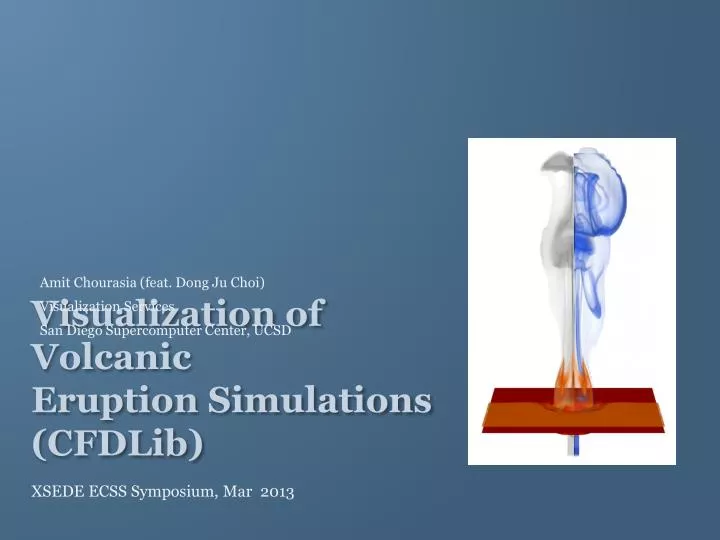
Amit Chourasia (feat. Dong Ju Choi). Visualization Services. San Diego Supercomputer Center, UCSD. Visualization of Volcanic Eruption Simulations (CFDLib). XSEDE ECSS Symposium, Mar 2013. PI: Darcy Ogden, SIO, UCSD Code: CFDLib (LANL) ECSS Team

E N D
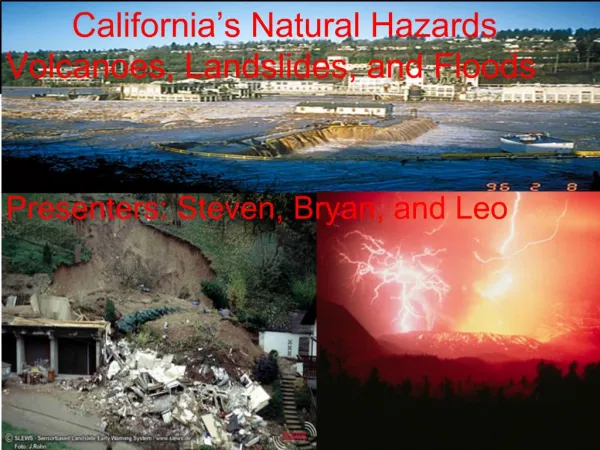
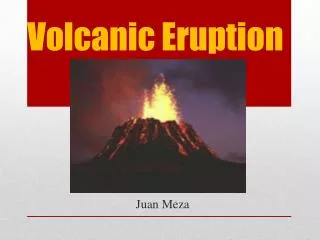
Amit Chourasia (feat. DongJu Choi) Visualization Services San Diego Supercomputer Center, UCSD Visualization of Volcanic Eruption Simulations (CFDLib) XSEDE ECSS Symposium, Mar2013
PI: Darcy Ogden, SIO, UCSD Code: CFDLib (LANL) ECSS Team • Computation: Dong Ju Choi, MahidharTateneni • Visualization: Amit Chourasia Project Team
Optimize CFDlib • Perform large scale runs on Gordon @ SDSC • Visualize data (existing and new) Project Goals
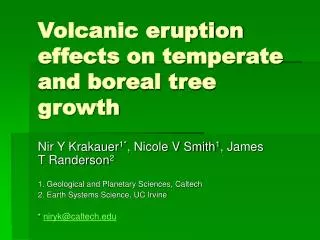
CFDLib (feat. Dong Ju Choi) Collection of hydro codes compressible flow incompressible flow multiphase flow Magneto hydrodynamic forces and multi-fluid solutions • Modular: enables fast code development • Serial only option to simulate the motion of a Lagrangian projectile (Rock deformation), passing through an Eulerian gas (Fume).
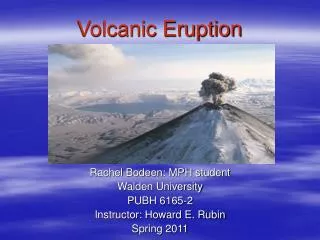
SIMULATION • Simulate explosive volcanic jets using CFDLib from LANL • Consider both rock deformation (in Lagrangian ) and gas explosion (in Eulerian)
Port the code on SDSC’s Gordon • Performance test to find a bottle neck and perform optimization • Large scale run on vSMP node (100 times more resolution) • Output found not correct. PI decided to abort the project because it debugging would not be easy • A new Java based implementation of the CFDLib is upcoming, the PI is transitioning to new code. • ECSS computation support is discontinued, but visualization work proceeded Computation
ASCII Tecplot files (300 MB per file) • ~15 variables (air, ash, steam, rock …) • Rectilinear adaptive grid (610x600x2000 cells) • 300 – 400 time steps per simulation • Simulation ensemble comprising of nine runs (varying input conditions of rock viscosity & pressure) Data
Study existing data • Study visualizations done by PI in Tecplot • Identify suitable visualization tools • Transform data • Create visualization for communication – ash, rock, steam, distribution • Identify features of interest for scientific enquiry – crater growth, mass flux distribution, etc … – crater area, etc .. Viz Work Plan
Identify viz tool • Data translation. VisIt unable to read existing files • How to display multiple volumetric variables simultaneously? • Develop adequate transfer functions for each variable? Challenges
Study and show volumetric distribution of air, ash, rock & steam
Mass Flux slice at 100m 200m 300m 400m 500m depths Each column shows different sim with low viscosity rock at varying pressure as input
Rock slice at 100m 200m 300m 400m 500m depths Each column shows different sim with low viscosity rock at varying pressure as input
Ash slice at 100m 200m 300m 400m 500m depths Each column shows different sim with low viscosity rock at varying pressure as input Movie
Movie Each row shows different simulation
Remote interactive visualization on Gordon and Trestles • Face to face and VNC sessions with the PI during interactive exploration of data • Batch visualization over time series • Create and share movies • Iterative process (rinse and repeat) Visualization Process Employed
Created several visualizations for investigation of new insights as well as communication of results • ~26 movies, ~100,000 images • ~30,000/50,000 SUs consumed in viz • Output data could be written out in parallel friendly format instead of ASCII Tecplot files. • Project plans evolve over time, sometimes revamped significantly. PIs priorities also change during the project. • Engaging the PI with hands on tutorial was very useful and productive • Documented and handed over the scripts, parameters and state files to the PI • PI can recreate and reuse settings for other similar data • Remote interactive visualization applications are now quite mature. End users can be trained to carry out basic tasks easily using VisIt. • Unsolicited quote from PI“These snapshot visualizations have been very useful for identifying key dynamics important to studying eruption physics.” Conclusions/Lessons
D.E. Ogden and K.H. Wohletz. “3D Numerical Models of Co-Eruptive Volcanic Vent Evolution and Influence on Eruptive Dynamics”. American Geophysical Union, Fall Meeting 2011, abstract #V33A-2607 • A. Chourasia, D. Ogden and K. Wohletz. “Snapshot of a Volcano Eruption Simulation”. XSEDE 12 Conference. Chicago • Another manuscript under preparation by PI Acknowledgement: Brad Whitlock (LLNL) for rapid bug fixes and suggestions for VisIt application. Publications