Download
1 / 34
610 likes | 1.25k Vues
Seismic Attenuation and Earth Structure. Douglas Wiens Department of Earth & Planetary Sciences Washington University in Saint Louis. Gung & Romanowicz [2004]. Pozgay , Wiens, et al. [2009]. Outline . What is seismic attenuation? How is it measured?

E N D
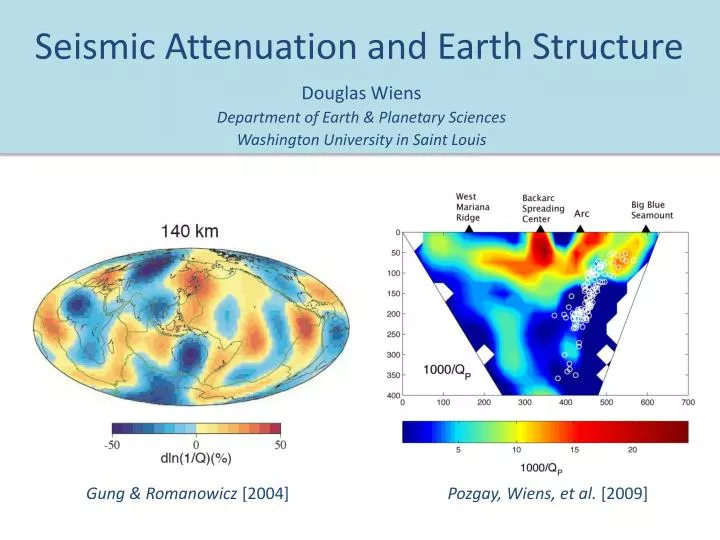
Seismic Attenuation and Earth Structure Douglas Wiens Department of Earth & Planetary Sciences Washington University in Saint Louis Gung & Romanowicz[2004] Pozgay, Wiens, et al. [2009]
Outline • What is seismic attenuation? • How is it measured? • How is it related to earth properties such as temperature and composition ? • Global attenuation structure • Attenuation and geodynamic processes
Seismic Attenuation • In a perfectly elastic medium, the total energy of the wavefield is conserved • Seismic attenuation is the absorption of seismic energy, or the deviation from perfect elasticity Surface waves Body waves Coutier & Revenaugh[2006] Widmer & Laske[2007]
Q – Quality Factor • Attenuation is quantified by 1/Q, in analogy to the damped harmonic oscillator (underdamped) • Smaller Q results in faster damping (greater deviation from elastic case) • Frequency-independent Q damps high frequencies more than low frequencies • Q = 2π (total energy/energy lost during one cycle)
Shear and Bulk Q • Shear wave attenuation results from relaxation of the shear modulus (μ) • P wave attenuation results from the relaxation of both the shear (μ) and bulk (κ) moduli • In general bulk attenuation is thought to be very small in the earth (Qκ> 1000) • If Qκ~ ∞ and assuming a Poisson Solid (λ = μ), QP= 2.25 QS
Absorption Band & Velocity Dispersion • A single relaxation time gives an absorption peak at ω = 1/τ • Velocity increases from relaxed to unrelaxed values at about the same frequency • A spectrum of relaxation times superposes these effects
Frequency Dependence of Attenuation Lekic et al. [2009] • Q is observed to be weakly frequency dependent in the “seismic band” • Described as Q = Q0ω-α • Interpreted as a broad spectrum of relaxation times
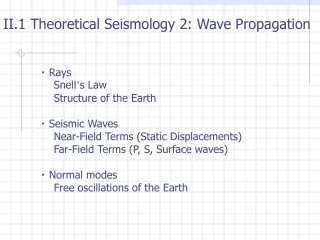
How do we measure seismic attenuation? • Use many of the same data types as for seismic velocity studies • Free Oscillations (Normal Modes) • Surface Waves • Global and Regional • Body Waves (P & S) • Global and Regional
Normal Modes • Different Modes show different rates of amplitude decay • So we can determine a Q for each mode • Different Qs result from how each mode samples the earth
Surface wave attenuation measurements Amplitude Decay with Distance Rayleigh Wave Sensitivity vs Depth Yang and Forsyth [2008] Dalton and Ekstrom[2006]
Differential Attenuation • Determine attenuation of a region by comparing two similar phases • Advantage is eliminating source, receiver effects Flanagan & Wiens [1998]
Inner Core Attenuation • Inner core attenuation determined by comparing PKPdfto PKPaband PKPbc Waveform from Vern Cormier
Regional Body Wave Attenuation MeasurementsSolve for earthquake corner frequency and attenuation along each pathTomographic inversion of attenuation along raypathsfor 3D structure Solve for Corner Frequency Low Attenuation Path High Attenuation Path
Attenuation of Earth Materials: Experiments • Difficult experiments at seismic frequencies • and mantle conditions • Torsion apparatus: measures shear • modulus as a function of frequency • and temperature at mantle pressures • Major questions: the effect of melt • and water Figure from Ian Jackson
Possible Attenuation Mechanisms Another Mechanism: Dislocation Damping (Farla et al., 2012) • Identification of mechanism is necessary to scale results from lab to earth • Scaling in grain size, temperature, pressure, etc.
Attenuation vs Frequency, Temperature, Grainsize Jackson & Faul[2010] Stonggrainsize dependence interpreted in terms of grain boundary sliding
Different Extrapolation: Master Curve analysis(McCarthy et al., 2011) Many studies, materials scaled by Maxwell Frequency fM = f η(T,d)/E(T) E = Young’s (elastic) Modulus η = steady-state viscosity
Models agree at lab-sample sizes…… but vary at mantle grain sizes • Blue: Jackson&Faul 2010; Red: McCarthy et al. 2011 Mantle(?): d = 5 mm Lab: d = 5 μm All 2.5 GPa, constant d, dry olivine Slide from Geoff Abers
Experimental Results: Effect of Melt on Attenuation Melt-bearing Melt-free Faulet al. [2004]
Melt has a large effect on attenuation Faul et al. [2004] • Line thickness gives melt content; line color gives grain size • For a given grainsize, 1% melt gives nearly an order of magnitude • increase at 1 Hz
Attenuation from Water in Olivine Karato, 2003 • Experiments: Aizawa et al [2008] shows effects but no quantitative relationship • Karato [2003] extrapolates from the rheological effect • MORB source is 0.005 wt % water (810 ppm H/Si) • At 100 km depth water < 0.02 wt % [Hirschmann, 2006] • Lowers Qs from 80 to 60; 2% decrease in seismic velocity • Water dissolved in “anhydrous” minerals has limited effect on velocity and attenuation at depths < 100 km due to low solubility; water is mostly present as an aqueous melt
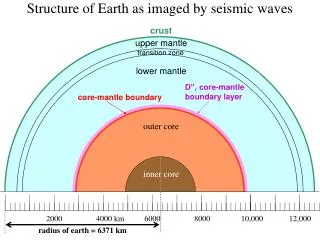
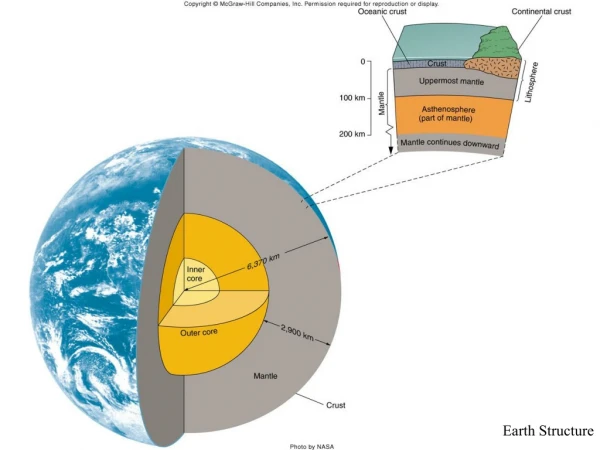
Global Attenuation Structure • Average 1-D attenuation model from modes and surface waves • Highest Attenuation is in the asthenosphere • and inner core • Low attenuation in the lithosphere and • lower mantle Durek & Ekstrom[1996]
Global Attenuation Structure from Surface Waves Dalton et al [2008]
Attenuation and Velocity Anomalies are Highly Correlated Q model S Velocity Model Dalton et al. [2009]
Joint US-Japan 11 month deployment of 58 OBSs and 20 Land Seismographs • Primary goal was to image mantle wedge processes associated with magmatism Deployment Map Regional Studies – Subduction Zone Magmatism Deployment of US LT OBS from R/V Kaiyo, June, 2003
Attenuation tomography - Mariana Arc and Backarc Pozgay et al. [2009] • Slow velocity high attenuation beneath the arc at 30-100 km depth • Sheet-like high attenuation anomaly beneath spreading center 75 km wide, extends to 100 km depth • Arc and spreading center anomalies separated at shallow depths
Comparison with Basalt Geobarometry = maximum anomaly • Si & Mg thermobarometry suggest a final equilibration depth of magma: 21-34 km for the backarc spreading center 34-87 km for the volcanic arc [Kelley et al., 2010] • Corresponds perfectly with the strongest anomalies beneath the backarc and arc • Shows that velocity and Q anomalies delineate the melt production region • Anomalies result from small fractions of in-situ melt
Attenuation structure comparison - Mariana vs Lau (Tonga) backarc spreading centers Pozgay et al [2009] Roth et al, 1999; Reprocessed by J. Conder • Tonga shows much higher attenuation, greater depth extent • Consistent with higher temperatures and greater melt productivity • Much broader anomaly - passive vs active upwelling at ridge?
Modeling Attenuation Structure – Tonga/Fiji Calculated Q model [Faul and Jackson, 2005] Temperature model Q tomography Wiens, Conder & Faul[2008]
Central America Attenuation Broad, high attenuation (low Q) region in wedge. At 1 Hz (assume Q=Qs1 f0.27): Qs1 = 62 – 84 (Costa Rica) Qs1 = 38-73 (Nicaragua) (Rychert et al., 2008 G-Cubed)
Backarc Melt Porosity inferred from Attenuation Method • Use Jackson et al [2004] experimental relations • Assume 1 cm grain size • Try to match maximum attenuation of Qs ~ 20 for Lau and Qs ~ 40 for Mariana • Use temperature constraint from basalt geochemistry [Wiens, Kelley & Plank, 2006] Result • Large difference between melt-free and even small melt fraction • Large melt fractions predict greater attenuation than observed • Constraints are fit with small melt fraction (0.1%) for both Lau and Mariana
Conclusions • Attenuation furnishes an important constraint on material properties in the earth, somewhat independent of seismic velocities • Global surface wave attenuation models correspond closely with shear velocity, suggesting that temperature is the primary controlling factor in both • In the Mariana islands, the melt source region is imaged at 40-90 km depth beneath the arc and 20-50 km depth beneath the backarc spreading center, in accord with geochemical constraints • Attenuation anomalies between different arcs/backarcs correspond well with temperatures inferred from geochemistry, and suggest melt porosities of less than 0.2 %.