Download
1 / 14
160 likes | 301 Vues
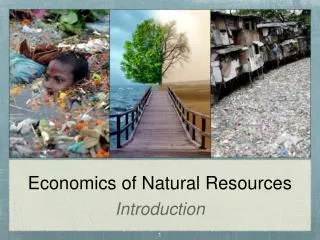
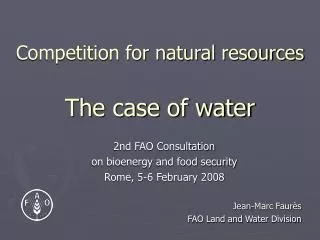
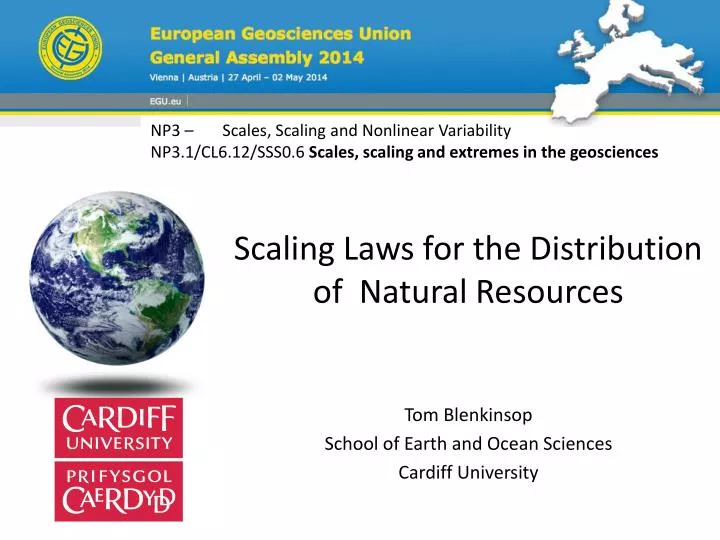
NP3 – Scales, Scaling and Nonlinear Variability NP3.1/CL6.12/ SSS0.6 Scales , scaling and extremes in the geosciences. Scaling Laws for the Distribution of Natural Resources. Tom Blenkinsop School of Earth and Ocean Sciences Cardiff University.

E N D
NP3 – Scales, Scaling and Nonlinear Variability NP3.1/CL6.12/SSS0.6 Scales, scaling and extremes in the geosciences Scaling Laws for the Distribution of Natural Resources Tom Blenkinsop School of Earth and Ocean Sciences Cardiff University
Scaling Relationships for Natural Resources • Data sets: Gold, Gas • Results • Percolation Theory
The Mass Dimension, Dm M(r) = C1rDm cf. The radial density function: r(r) = CM(r)/pr2 = C1r Dm-2 The Mass-Radius Scaling Exponent, DmrM(r) =C2rDmr
Understanding the Exponents • Space filling, random or uniform patterns: Dm = 2 • A point: Dm = 0 • Dm and Dmrmeasure how mass varies as a function of distance from a point, or the degree of clustering. • Dmvalues less than 2 indicate a decrease in density with distance, a characteristic of fractal patterns. • Dmr can have values > 2
Gold deposits, Zimbabwe craton Dm = 1.05 Dmr = 1.02
Clustering near edges of study area Roll-off: Sampling from a fractal distribution
Conventional Gas Wells, Pennsylvannia Dm = 1.63 Dmr = 1.72
Unconventional Gas Wells, Pennsylvannia Dm = 1.26 Dmr = 1.32
Gold and Gas:Structural controls and fluid flow Golden Pig Mine, Western Australia Pennsylvannia Gas wells In the Marcellus shales
Percolation clusters P = 0.26 P<Pc D = 1.56 Percolation Threshold, Pc P = 0.37 P~ Pc D = 1.9
Conclusions • The percolation threshold has not been reached for gas or gold fluid flow networks in the crust • Dm, Dmr (gold) < Dm, Dmr (gas) • The less clustered pattern of the gas distribution reflects the more pervasive source/trap geology of the gas deposits compared to the stronger structural control of the gold, which localisesdeposits • Mass Radius-Scaling (Dmr) exponents are similar to Mass Dimensions (Dm) for Archean Gold deposits and gas wells in Pennsylvannia • Percolation theory is an attractive hypothesis to explain distributions of these natural resources