Download
1 / 19
190 likes | 288 Vues
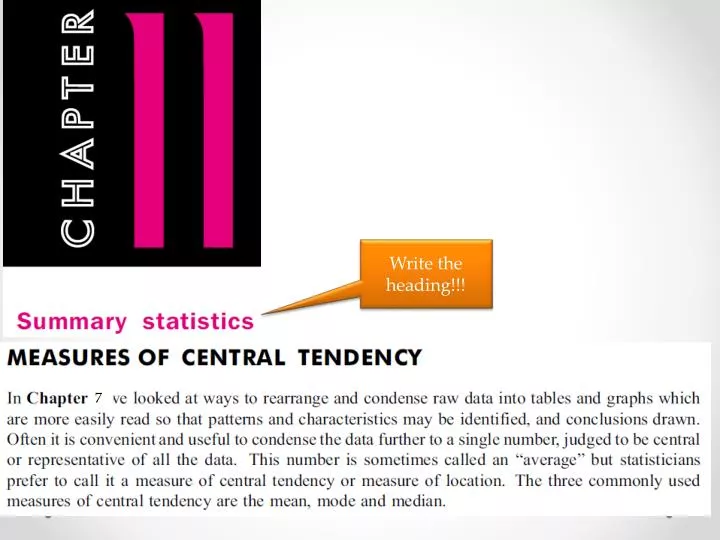
Write the heading!!!. 7. text. Write the heading!!!. Theory/Notes. How to do this on the calculator???. Write the theory!!!. Ex 11A (p356-359) Q1( a,c,e ), 4(a, b),. Write the heading!!!.

E N D
Write the heading!!! 7 text
Write the heading!!! Theory/Notes How to do this on the calculator??? Write the theory!!! Ex 11A (p356-359) Q1(a,c,e), 4(a, b),
Write the heading!!! Copy the Example, but add two columns to the right for ‘class-centre’ and fx like the one below We need to use the ‘class-centre’ in our calculations for ‘mean’ Ex 11A (p359) 6a, 7a
Write the heading & the theory Ex 11A (p359) 6a, 7a Ex 11B p361 Q1,2(ev 2nd part)
Write the heading & theory!!! Copy out the Examples
Write the heading Don’t copy out – just watch & learn
Theory/NotesWrite this down… Ex 11C (p363-366) Q1-2 (a,c,e), 3(a), 4(a,b), 5(all), 6(a) Note: Q5,6 similar to Eg 5 (p365) Use this as your model
Write the heading & the Example below Ex 11D (p367)Q1 (all parts)
(2) Then read over p372, “The Range” (1) Do Ex 11E p369 Q1-5,7-9 (3) Write the heading & theory!!! (4) Then do Ex 11F Q1-3
(1) Write the heading, theory& example. To find the Interquartile Range, 1. Find the median (Q2). This splits the scores into a lower and upper set. 2. Find the median of the lower 50% (Q125%) and the median of the upper 50% (Q375%) of scores. 3. Calculate Q3 – Q1. Note: If using an OGIVE, find Q1 and Q3 from the graph. Example 1Eg.1 Find the interquartile range for the scores… 1,2,2,5,7,9,10,10,11,11,11,11 (2) Then do Ex 11G Q1. Then Read Eg 2(p374) and try Q2, Q5,6. (3) Look at this example as a class
Write the heading & theory!!! Class Discussion Example Don’t copy this one
Class Discussion Example Don’t copy this one either Copy this one & complete Eg. 1By creating a 5-Point summary for the set of scores below draw a box-and-whisker plot? (Use a horizontal scale of 1 cm = 2 marks) 40 42 44 45 48 50 52 53 54 57 59 60 Ex 11N Q1(a,c,e),2(a,c,e),3(a,c)
Write the heading and copy the theory/example • Statistics is about analysing sets of data. The standard deviation describes how spread out a set of scores is. • The smaller the standard deviation, the less the spread of the scores. • Standard deviation has the symbol n or xn. (Access this on your calculator) • Definition - Standard Deviation is found by finding the distances of all the scores from the mean and then taking an average of these distances. • Eg. 1 Find the standard deviation of 5, 4, 2, 7, 6, 3, 4, 5, 8
Class Discussion Example Don’t copy this one Copy the theory from the blue box • Sample Standard Deviation (n-1) • Another type of standard deviation exists that is best used when a sample is used, not entire an population set of data. Eg. If a sample is taken from a year group. • For sample standard deviations, we use the n-1 button. Ex 11O Q1-2; Ex 11P Q1-3