Download
1 / 17
170 likes | 258 Vues
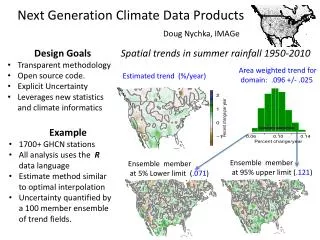
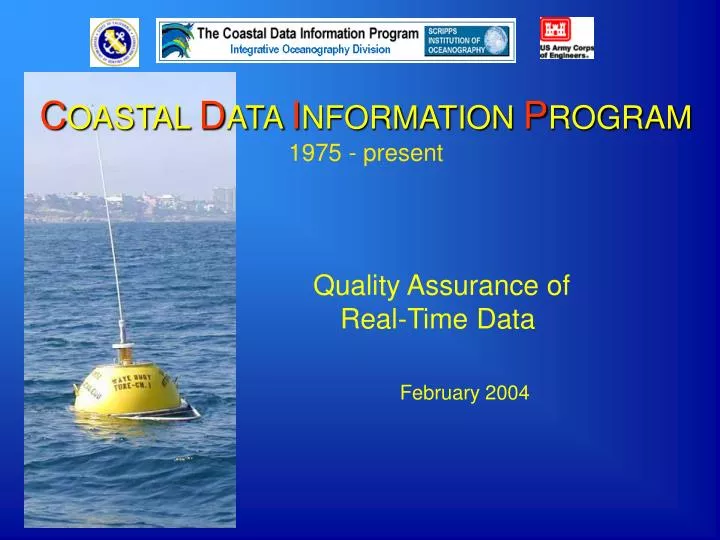
C OASTAL D ATA I NFORMATION P ROGRAM 1975 - present. Quality Assurance of Real-Time Data February 2004. Real-Time Web Products. Southern California Summary Map. Nowcast Model Products. 1995: Wave Data Standards Analysis – US Army Corps of Engineers

E N D
COASTALDATAINFORMATIONPROGRAM1975 - present Quality Assurance of Real-Time Data February 2004
Real-Time Web Products Southern California Summary Map Nowcast Model Products
1995: Wave Data Standards Analysis – US Army Corps of Engineers “… provide specifications on the analysis techniques that must be applied to wave data ….to ensure quality and uniformity of the final product. … The standard has evolved through a consensual approach involving the principal organizations which are responsible for the vast majority of wave measurements for this country. “ 2003: Handbook of Automated Data Quality Control Checks and Procedure of the National Data Buoy Center
QUALITY ASSURANCEPressure Sensor Calibration DEEP TANK Soak complete package (sensors & cable) – Establish noise floor • COLD BOX • Constant Temperature • Standard Paros • Battery of statistical test of dynamic pressure responses over several weeks to establish noise floor.
Generated from Aceh, Indonesia earthquake on Dec 26, 2005 @ 00:59UTC.
Quality Control SpecificationsPressure Sensors: Time Domain • Max Wave Height Test • Flat episodes Test • Spike Test • Max value Test: successive trough to crest • Min Value Test: successive trough to crest • Mean Shift Test • Equal Peaks Test • Acceleration Test • Mean crossing Test • Period Distribution Test
Quality Control SpecificationsWave Buoys: Frequency Domain • Check Factors Test – ratio of vertical to horizontal displacement • Inclination Test • Period exceedence Test Quality of Telemetery: • Discontinuities in transmission • Data Corruption
Central Computer Automated Real-Time Processing Time Series Time Domain Quality Control Frequency Domain PRODUCTS NWS/NDBC Transmission Station Specific Requests WEB UPDATEReal-Time/Historical Pub/Non-Public STORAGE rawspectralparameters Error/Diagnostic Statistics Post Processing Inter-comparison of last 24 hours
Waimea Buoy, HA – Frequency Domain QC 106: First indicated bad by TP errors > 30s -106 01 07/11/2003 20:19:30 hrs UTC code=551: (bdd_editor.f) Tp out of bounds: 33.33 Flagged as NON-PUB 7/11/03 BAD – Energy in Low Frequency for all records
Scripps Canyon NorthWest BuoyFrequency Domain QCCheck factor values 114 0108/16/2003 00:39:30 hrs UTC code=500: (bdd_editor.f) Abnormally high check factors (relationship between vertical and horizontal cross-spectra) Calibration Test – Bad displacement Direction & Period erratic. Retrieved buoy and performed calibration tests.
Wave Data Torrey Pines Inner – 20m deep Torrey Pines Outer – 549m deep Buoys approximately 6 miles apart
Dana Point Buoy, CA First indicated bad by inclination errors (> 5°) • 096 01 09/13/2003 18:59:30 hrs UTC code=702: (buoy_stats.f) Inclination off, arch: 58.52 file: 52.73 GOOD DISPLACEMENT PLOT BAD – Exagerrated Horizontal Amplitude
Modeling Waves Across the Basin Headland shadowing Refractive effects Directional wave buoy to initiate model Island shadowing Diffraction effects Amplificationover shoals
Pacific Gas & Electric Company Diablo Canyon Nuclear Power Plant 2004
CDIP In-House Diagnostics • Paged: • off site (GPS & ARGOS) • data is > 1 hr old, • computer system is down, • computer partitions are > 90% full. • Programmers emailed : • Offsite • Data > 1 hr old, power outages, data transfer failedSystem messages
CDIP Diagnostics 2004- Data Collection Coverage Percentages --------------------------------- La Jolla – 99.89% Torrey Pines O – 95.29% San Pedro – 95.24 Santa Monica – 99.64% Pt Dume – 95.88% Goleta – 97.06% Harvest – 94.70% Pt. Reyes – 91.88% Grays Harbor – 99.31% Guam – 99.72%