Download
1 / 16
160 likes | 405 Vues
Be smart in choosing graphics. A SmartArt graphic is a visual representation of information. It’s very easy to create. This picture shows a graphical timeline that captures the milestones in a production schedule. . Here are some other ways to use a SmartArt graphic:.

E N D
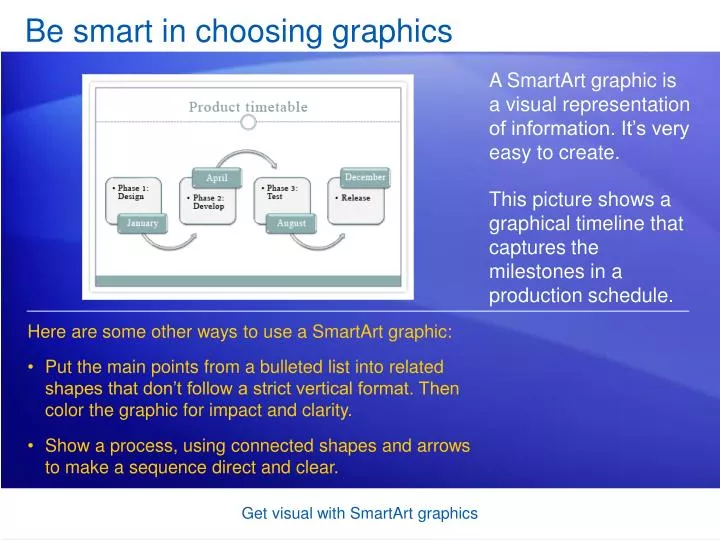
Be smart in choosing graphics A SmartArt graphic is a visual representation of information. It’s very easy to create. This picture shows a graphical timeline that captures the milestones in a production schedule. Here are some other ways to use a SmartArt graphic: • Put the main points from a bulleted list into related shapes that don’t follow a strict vertical format. Then color the graphic for impact and clarity. • Show a process, using connected shapes and arrows to make a sequence direct and clear. Get visual with SmartArt graphics
Types of SmartArt graphics When you want to use a SmartArt graphic, you’ll have a gallery of layouts to choose from. Layouts are collected in full in the All category within the Choose a SmartArt Graphic dialog box. Then, as the picture shows, they’re broken down into different types including List, Process, Cycle, Hierarchy, Relationship, Matrix, and Pyramid. Get visual with SmartArt graphics
List-type graphics This SmartArt graphic uses a List-type layout. The graphic keeps the vertical list idea but separates the general concepts, shown in the shapes on the left, from the details. Those are reserved for the longer shapes, with smaller text, on the right. Get visual with SmartArt graphics
List-type graphics This SmartArt graphic uses a List-type layout. List layouts are typically for items that you want to group but that don’t follow a step-by-step process. To keep text size readable, you’ll want to limit the amount of text you put in the shapes within the graphic. Get visual with SmartArt graphics
Lists with pictures This graphical List layout includes shapes that are meant for pictures you insert. There’s room for descriptive text in the shapes on the right. There are several other List layouts that include shapes for pictures. These layouts save you the trouble of having to position and size the pictures once you insert them. They do that work for you. Get visual with SmartArt graphics
Process-type graphics The SmartArt graphic here uses a Process-type layout that contains repeating shapes and one long, winding arrow to connect each step and show a directional flow. You could substitute any shapes for these. For example, you might want to use standard flowchart shapes to represent different types of steps. Get visual with SmartArt graphics
Process-type graphics There are over 30 types of layouts for processes. They often include connecting arrows to show direction or progression—be it for phases in the development of a plan or product; points in a timeline; or a depiction of how elements combine in any fashion to produce a result. Get visual with SmartArt graphics
Processes with numbered steps This Process-type layout includes shapes that lend themselves to including numbers for the steps. The arrows keep the timeline idea and hold the text that describes each phase. This layout emphasizes the broad picture. Other ones might give more emphasis to the textual details of the steps. Get visual with SmartArt graphics
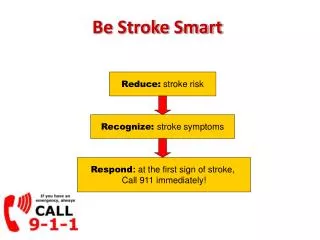
Performance management Wash, rinse, repeat. That’s a short way to describe content for the Cycle type of SmartArt graphic. The type shown here illustrates a circular, or repeating, process. The layout effectively shows both the cycle and how each piece of it fits into a whole. Get visual with SmartArt graphics
Hierarchy: An org chart A typical use for this SmartArt graphic type, called Hierarchy, is the company organization chart. This picture uses the layout that’s best geared toward showing a company’s hierarchy of positions. There are various hierarchical layouts, though. For example, a hierarchy might show a decision tree or family of products. Get visual with SmartArt graphics
Hierarchy: Family of products This Hierarchical layout shows the branches of a family of outdoor equipment. It works vertically, using shape size, text, and color-coding to make the levels clear. Get visual with SmartArt graphics
Relationships: Radial, Venn, Target The Relationship-type layouts cover a range of diagram types, including radial, Venn, and target. These typically depict a connection between two or more sets of things or information. This SmartArt graphic uses a Converging Radial layout, in which several elements relate to or affect one central thing. Get visual with SmartArt graphics
Relationships: Radial, Venn, Target The Relationship-type layouts cover a range of diagram types, including radial, Venn, and target. These typically depict a connection between two or more sets of things or information. The Basic Venn layout, consisting of two or more overlapping circles, shows how areas or concepts overlap and come together at the center intersection. Get visual with SmartArt graphics
Relationships: Radial, Venn, Target The Relationship-type layouts cover a range of diagram types, including radial, Venn, and target. These typically depict a connection between two or more sets of things or information. The Basic Target layout is used to show containment, gradations, or hierarchical relationships. Get visual with SmartArt graphics
Matrix The Matrix layout type shows the relationship of components to a whole. This layout type can depict more complex relationships by using axes, such as the example here. This layout is called a Grid Matrix. Each axis functions to show a range in terms of cost and of craft. The layout itself includes the quadrants and the axes, but it’s set up so you can add whatever labels apply, outside the axes. Get visual with SmartArt graphics
Pyramid The Pyramid-type layouts show proportional, foundation-based, or hierarchical relationships or processes that typically build upward. This example shows an ever-refining process that starts with gathering unfiltered data, shown at the bottom, continues upward with sifting through the data, and moves toward drawing conclusions about it. The layout is designed to give you more room for text as the pyramid narrows. Get visual with SmartArt graphics