Download
1 / 4
40 likes | 165 Vues
This just in: ZoomCharts is among the latest in tech trends you should know about. Labs of Latvia has dubbed it a “rising star” in its roundup of the best in Latvian startups, which showcases what kind of tools, web services, and mobile apps tech guys and girls in the know are currently using. Labs of Latvia is a new Riga based community platform for Latvian startups by Latvian startups. It provides information about the Latvian startup scene for startups, investors, media, and the Latvian startup community at large. Check them out at http://labsoflatvia.com ZoomCharts offers the world’s most interactive data visualization software, with completely interactive charts and graphs that support massive amounts of data, can be used with all modern devices, and perform at incredibly fast speeds. Be among the growing number of professionals using ZoomCharts to bring data to the next level with beautifully crafted interactive visuals for all of your data presentation needs. Check out ZoomCharts products: Network Chart Big network exploration Explore linked data sets. Highlight relevant data with dynamic filters and visual styles. Incremental data loading. Exploration with focus nodes. Time Chart Time navigation and exploration tool Browse activity logs, select time ranges. Multiple data series and value axes. Switch between time units. Pie Chart Amazingly intuitive hierarchical data exploration Get quick overview of your data and drill down when necessary. All in a single easy to use chart. Facet Chart Scrollable bar chart with drill-down Compare values side by side and provide easy access to the long tail. ZoomCharts http://www.zoomcharts.com The world’s most interactive data visualization software

E N D
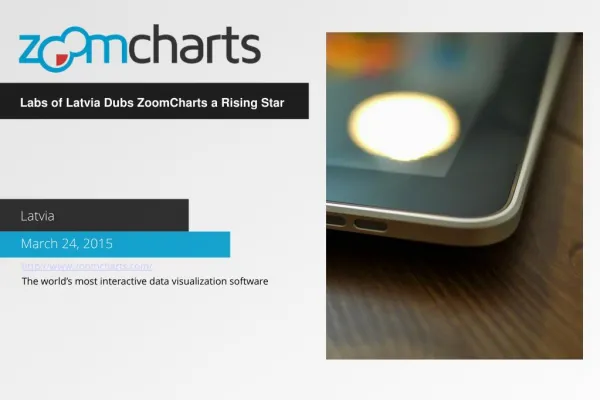
Labs of Latvia Dubs ZoomCharts a Rising Star Latvia March 24, 2015 http://www.zoomcharts.com/ The world’s most interactive data visualization software
Labs of Latvia Dubs ZoomCharts a Rising Star This just in: ZoomCharts is among the latest in tech trends you should know about. Labs of Latvia has dubbed it a “rising star” in its roundup of the best in Latvian startups, which showcases what kind of tools, web services, and mobile apps tech guys and girls in the know are currently using. Labs of Latvia is a new Riga based community platform for Latvian startups by Latvian startups. It provides information about the Latvian startup scene for startups, investors, media, and the Latvian startup community at large. Check them out at http://labsoflatvia.com ZoomCharts offers the world’s most interactive data visualization software, with completely interactive charts and graphs that support massive amounts of data, can be used with all modern devices, and perform at incredibly fast speeds. Be among the growing number of professionals using ZoomCharts to bring data to the next level with beautifully crafted interactive visuals for all of your data presentation needs.
Check out ZoomCharts products: Network Chart Big network exploration Explore linked data sets. Highlight relevant data with dynamic filters and visual styles. Incremental data loading. Exploration with focus nodes. Time Chart Time navigation and exploration tool Browse activity logs, select time ranges. Multiple data series and value axes. Switch between time units. Pie Chart Amazingly intuitive hierarchical data exploration Get quick overview of your data and drill down when necessary. All in a single easy to use chart. Facet Chart Scrollable bar chart with drill-down Compare values side by side and provide easy access to the long tail. ZoomCharts http://www.zoomcharts.com/ The world’s most interactive data visualization software