Download

1 / 55
670 likes | 1.15k Vues
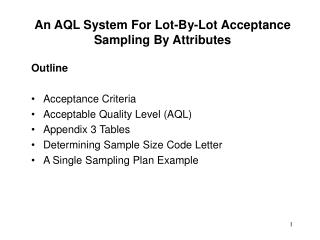
15. Lot-by-Lot Acceptance Sampling for Attributes. The acceptance sampling problem. An old method used in the 1930’s and 40’s. The purpose of AS is to inspect received lots of products and decide whether to accept or reject the lot; lot disposition , or lot sentencing .

E N D
15 Lot-by-Lot Acceptance Sampling for Attributes Dr. Shokri Selim, KFUPM
The acceptance sampling problem • An old method used in the 1930’s and 40’s. • The purpose of AS is to inspect received lots of products and decide whether to accept or reject the lot; lotdisposition, or lot sentencing. • Accepted lots are put into production • Rejected lots may be returned to supplier or subjected to other lot-disposition action • Sampling methods may also be used during various stages of production Dr. Shokri Selim, KFUPM
Note that: • The purpose of AS is sentencing lots and not estimate • lot quality. • 2. It could happen that, lots of same quality be sentenced • differently based on the sample. • 3. AS is an audit tool • 4. Control charts are used to signal departures from • quality. Dr. Shokri Selim, KFUPM
Approaches to lot sentencing • Accept without any inspection Supplier process is very good and defectives are rare or there is no economic justification to look for defectives • 100% inspection Use if defective components can cause high failure cost or supplier process does not meet specifications • Acceptance sampling Dr. Shokri Selim, KFUPM
When is AS used? Dr. Shokri Selim, KFUPM
Advantages of sampling Dr. Shokri Selim, KFUPM
Disadvantages of sampling • There is a risk of accepting “bad” lots and rejecting “good” lots. • Less information is generated about the product or about the process that manufactured it. • Acceptance sampling requires planning and documentation where as 100% inspection does not Dr. Shokri Selim, KFUPM
Types of sampling plans • One major classification is by data type, • variables and attributes • Another is based on the number of samples • required for a decision. Dr. Shokri Selim, KFUPM
Types based on number of samples • Single-sampling plans • Select a sample of size n. If the number of defectives ≤ c, accept lot, else, reject the lot. • Double-sampling plans • Select a sample of size n, then depending on the number of defective • accept the lot • reject the lot • take a second sample and decide on both samples • Multiple-sampling plans • similar to double but with more than 2 samples • Sequential-sampling plans • units are selected one at a time and decision to accept or reject or continue is made Dr. Shokri Selim, KFUPM
Single-, double-, multiple-, and sequential sampling plans can be designed to produce equivalent results. • A lot of the some quality level has the same probability of being accepted by these plans. • Factors to consider include: • Administrative efficiency • Type of information produced by the plan • Average amount of inspection required by plan • Impact of the procedure on manufacturing flow Dr. Shokri Selim, KFUPM
Lot formation • There are a number of important considerations in forming lots for inspection, including: • Lots should be homogeneous. • Same machine, same raw material, same operator • Larger lots are preferred over smaller ones. • More economic • Lots should be conformable to materials-handling systems used in both supplier and consumer facilities. • Lot packaging minimizes risk of damage • Selection of sample is easier Dr. Shokri Selim, KFUPM
Random sampling • Assign a number to each item and select n random numbers to form a sample or • Randomly select the length, depth and width in the container or • Stratify the lot into layers, then cubes. Dr. Shokri Selim, KFUPM
Guidelines for using acceptance sampling • The selection of a sampling plan depends on the objective and the history of the supplier. • Non-static nature of AS plans If supplier is known for quality, start with sampling plan for attributes. If quality is proven, may use skip-a-lot policy. If capability is high may stop sampling. If supplier quality is not known, use an attribute plan. If quality is good may use a variable plan, and help them in SPC • Companies start with AS and shift to SPC as the quality improves. Dr. Shokri Selim, KFUPM
Single sampling plans for attributes Definition of a single sampling plan The plan is defined by the sample size n and the acceptance number c. If the number of defectives, d ≤ c accept the lot, else reject the lot. Dr. Shokri Selim, KFUPM
Types of Lot Size Type A: Lot size is finite Type B: Lot size in infinite Dr. Shokri Selim, KFUPM
Type B OC curves The OC curve gives the probability of accepting the lot given the lot fraction defective Main assumption: lot size is very large Let p = probability a unit is defective d = number of defectives in a sample of size n Probability of accepting a lot: Dr. Shokri Selim, KFUPM
Sample OC curve Dr. Shokri Selim, KFUPM
The ideal OC curve Reject lot if p > 0.025 Can we choose n and c that give similar OCC? Dr. Shokri Selim, KFUPM
Effect of n Dr. Shokri Selim, KFUPM
Effect of C Dr. Shokri Selim, KFUPM
Type-A and Type-B OC curves • If the lot size is vey large, we use the binomial • distribution to model the P(d ≤ c) • If the lot size is finite we use the hypergeometric • distribution. Dr. Shokri Selim, KFUPM
Constructing Type A OCC Let N be the lot size D be the number of defectives in the lot N be the sample size C be the maximum number of defectives allowed DEMO Dr. Shokri Selim, KFUPM
Relation between Types A and B If N is large (N ≥ 10n ) both graphs are close. DEMO Type A and Type B OC curves Dr. Shokri Selim, KFUPM
Behavior of Type B OC curve for c = 0 Plans with c = 0. OC curve far from the ideal OCC. Pa falls sharply as p increases Dr. Shokri Selim, KFUPM
Behavior of Type A OC curve for c = 0 Plans with c = 0 and N = 10n OC curve far from the ideal OCC. Pa falls sharply as p increases N = 10n but the OCCs behave differently. p = D/N Dr. Shokri Selim, KFUPM
Specific points on the OC curve • Acceptable quality level, AQL = the least quality • level for the supplier’s process that a consumer • would consider to be acceptable. The consumer • assigns high acceptance probability to it. • Lot tolerance percent defective, LTPD = • Rejectable quality level, RQL = • the least quality level, that the consumer is willing to accept with small acceptance probability. • We can design a plan that almost satisfies both conditions. Dr. Shokri Selim, KFUPM
Designing a single-sampling plan with a specified OC curve p1 = AQL p2 = RQL DEMO Dr. Shokri Selim, KFUPM
N ≥ 10 n Binomial monograph Dr. Shokri Selim, KFUPM
N ≥ 10 n Binomial monograph Dr. Shokri Selim, KFUPM
Rectifying inspection Incoming lots Fraction Defectives P0 Outgoing lots Fraction Defectives P1 < P0 Rejected lot has 0 defectives Inspection activity Accepted lot has P0 fraction defectives No of defectives = P0(N-n) Average number of defective units = pa(N – n)p0+ ( 1 – pa)x0 Average outgoing quality, AOQ = pa(N – n)p0/N Dr. Shokri Selim, KFUPM
Example N = 1000, n =100, c = 3, p = 0.01 pa = 0.9816 Average outgoing quality = AOQ = pa(N – n)p/N = 0.009 Dr. Shokri Selim, KFUPM
AOQ for N very large AOQ = pa(N – n)p/N = pa(1 – n/N)p ≈ pa p AOQL is the maximum point on the curve AOQ limit = worst AQL For the example; AOQL = 0.019417 Dr. Shokri Selim, KFUPM
Average total inspection Number of inspected items: If d ≤ c, n units will be inspected. If d > c, N units will be inspected. ATI = pa n + ( 1 – pa )*N = n + ( 1 – pa )*( N – n) If N= 1000, n= 100, c = 3, p= 0.01 pa = 0.9816 andATI = 116.56 Dr. Shokri Selim, KFUPM
ATI = n + ( 1- pa )*( N – n) Does the behavior of the graph makes sense? ATI for sampling plan: n = 89, c = 2 for lot sizes of 1000, 5000, 10,000 Dr. Shokri Selim, KFUPM
Selection of n and c based on AOQL and ATI • If AOQL is specified, the solution is not unique • We find n and c that minimize ATI given some AOQL value Dr. Shokri Selim, KFUPM
Double, multiple, and sequential sampling Double Sampling Plans • n1 = sample size on the first sample • c1 = acceptance number of the first sample • n2 = sample size on the second sample • c2 = acceptance number of the second sample • If d1 in the first sample is ≤ c1 accept the lot • If d1 in the first sample is > c2 reject the lot • Otherwise take 2nd sample. • If d1 + d2 ≤ c2 accept the lot • Otherwise, reject the lot. Dr. Shokri Selim, KFUPM
Advantage of double sampling over single sampling plans HW: read the advantages and disadvantages Dr. Shokri Selim, KFUPM
Constructing the OC curve for double sampling plans Dr. Shokri Selim, KFUPM
Supplementary OC curve Primary OC curve Supplementary OC curve Dr. Shokri Selim, KFUPM
Example n1 = 50, C1 = 3, n2 = 150, C2 = 6 Dr. Shokri Selim, KFUPM
The average sample number It is the average number of inspected units ASN = n1 + n2 Pr( c1 < d1 ≤ c2 ) What is the assumption here ? The assumption We complete the inspection of the second sample even after the total number of defectives has exceeded c2 Dr. Shokri Selim, KFUPM
Curtailment It is stoppage of sampling when the rejection condition is satisfied Do not do it with the first sample Why ? To be able to estimate the fraction defective. However, can do on the second sample. Dr. Shokri Selim, KFUPM
Rectifying Inspection with double sampling If all defective items are discovered, either in sampling or 100% inspection, and are replaced with good ones: Dr. Shokri Selim, KFUPM
Multiple Sampling Plans Example: Dr. Shokri Selim, KFUPM
At the completion of stage i: If d1 + d2 + … + di ≤ acceptance number → Accept lot If d1 + d2 + … + di≥ rejection number → Reject lot Otherwise take the next sample Usually, the first sample is inspected 100%. Usually, subsequent samples are subject to curtailment Dr. Shokri Selim, KFUPM
Suppose d1 = 1 Take 2nd sample, what value of d2 will result in accepting lot? what value of d2 will result in rejecting lot? suppose d2 = 1 Take 3nd sample, what value of d3 will result in accepting lot? what value of d3 will result in rejecting lot? Dr. Shokri Selim, KFUPM