Download
1 / 26
270 likes | 414 Vues
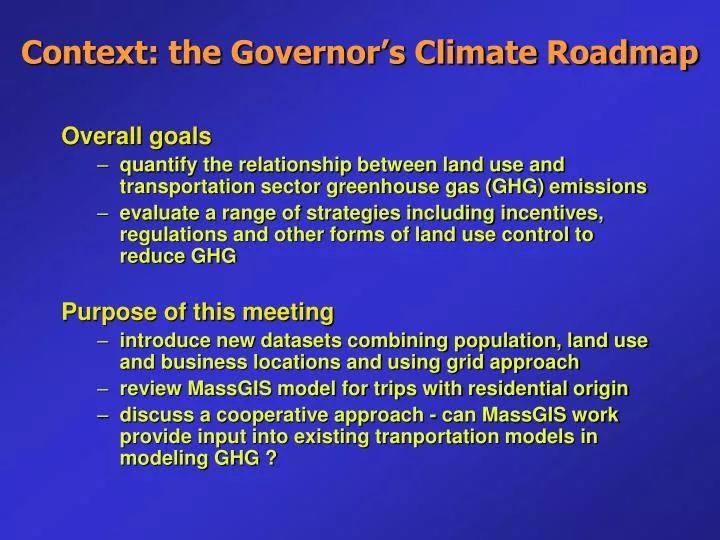
Context: the Governor’s Climate Roadmap. Overall goals quantify the relationship between land use and transportation sector greenhouse gas (GHG) emissions evaluate a range of strategies including incentives, regulations and other forms of land use control to reduce GHG

E N D
Context: the Governor’s Climate Roadmap Overall goals • quantify the relationship between land use and transportation sector greenhouse gas (GHG) emissions • evaluate a range of strategies including incentives, regulations and other forms of land use control to reduce GHG Purpose of this meeting • introduce new datasets combining population, land use and business locations and using grid approach • review MassGIS model for trips with residential origin • discuss a cooperative approach - can MassGIS work provide input into existing tranportation models in modeling GHG ?
Automated approach using GIS • Create statewide grid of 250 meter cells • Allocate block level Census household and population data to grid cells based on residential land use • Map locations of all common destinations such as schools, grocery stores, libraries, restaurants etc. and assign to grid cells • Calculate distance from every cell to nearest (or several nearest) destination • Using a set of trip weights from National Household Travel Survey, estimate VMT for household origin trips • Calibrate model using published VMT figures
First question: Where do people live?
Why use a grid cell approach? • Many operations can be performed on grids with little computational expense including addition, multiplication, logical tests, spatial means, distance to nearest feature etc. • Small grid cell size supports modeling at a very local scale • Model can be easilty calibrated to published results and can be run iteratively with different scenarios
Second question: Where do people go?
grocerystore grocerystore Euclidean distance grid 4 cells 4 2 6 cells For each type of destination, create a grid that records the distance to the nearest location in every cell – this is called a “euclidean distance grid”
Focalsum grid 4 cells 2 For each type of destination, count the number of destinations at various distances from each cell - this is called a “focal sum grid”
Trip Weights (partial listing) need a surrogate for this item don’t use closest destination, use focal sum distance instead for 3-5 destinations
Grid cell computations Summing up grid cell values for each household, using just euclidian distance examples: distance to groceries x % of trips = total distance traveled to groceries / total trips distance to hardware x % of trips = total distance traveled to hardware / total trips distance to church x % of trips = total distance traveled to church / total trips etc. for 30 different destinations SUM of grid cell values x total number of trips = total distance traveled For each grid cell, we estimate the total distance travelled per household and we know the number of households, so we can estimate the total VMT for all households
Use of grid to estimate household trips (Ti * Di) Ttotal Wi = Ti / Ttotal Wi = 1 weight = trips to destination i divided by total trips Vtotal = (Wi * Di) = cell value = sum of weights multiplied by distances for all destinations = total travel over total number of trips for each household VMThouseholds = H * (Ti * Di) = H * Vtotal * Ttotal total vehicle miles = number of households times total travel for each household = number of households times cell value times total number of trips per household
Weighted average household VMT / trip (all non-work destinations)
Grid model results Assuming.... • 30% correction for “as the crow flies” based on limited sampling • 4.2 trips / household / day • 2000 Census and 2007 DNB model computes 145 million residential origin DVMT Point of the model is NOT to estimate VMT, however, but to understand variation in VMT based on geographic location Major gaps and problems: • JTW was based on census plus gross assumptions on average speed • social trips – not sure how to measure • weightings – is there a better survey Next steps – correlate with land use, population density, business density