Download
1 / 26
270 likes | 498 Vues
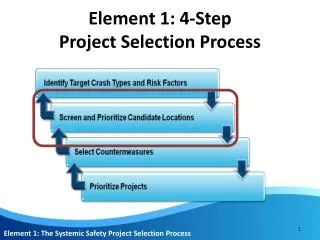
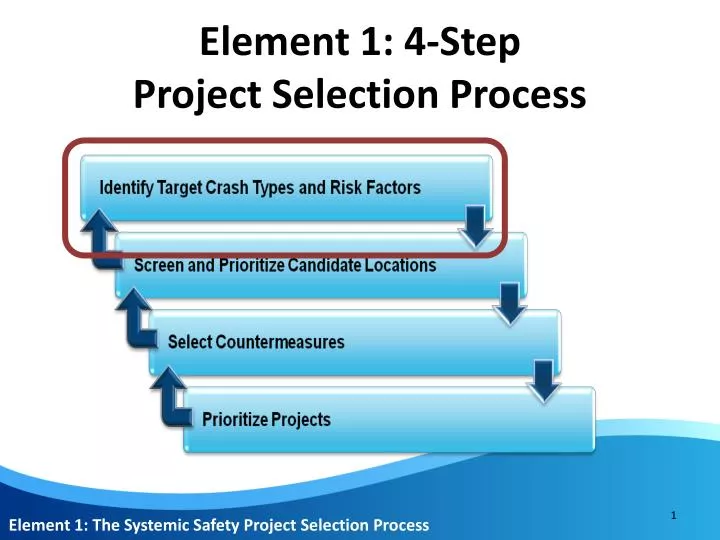
Element 1: 4-Step Project Selection Process. Element 1: The Systemic Safety Project Selection Process. Objective. Identify risk factors commonly associated with target crash type(s) experienced across a system. Suggest a focus on severe crashes (fatal + serious injury)

E N D
Element 1: 4-Step Project Selection Process Element 1: The Systemic Safety Project Selection Process
Objective • Identify risk factors commonly associated with target crash type(s) experienced across a system. • Suggest a focus on severe crashes (fatal + serious injury) • Consistent with national safety practices • May minimize effort and needed resources Element 1, Step 1: Identify Target Crash Types & Risk Factors
Outcome • Gain an understanding of the systemic program’s focus • Type of Crash • Facility Type (i.e., location type) • Risk Factors Element 1, Step 1: Identify Target Crash Types & Risk Factors
Recommended Minimum Data • Crashes by system (state and local) • Crash type (road departure, right angle, head-on rear end, turning, etc.) • Facility type (freeway, expressway and conventional) • Physical crash location description (urban/rural, intersection/segment, tangent/curve, topography, etc.) • Description of location (topography, intersection elements, segment elements) Element 1, Step 1: Identify Target Crash Types & Risk Factors
Potentially Useful Data(i.e., Risk Factors) • Traffic volumes • Some Roadway Features • Number of lanes • Shoulder type/width • Road edge features/quality • Number/type of access • Radius of horizontal curves • Density of horizontal curves • Speed limit • Medians • Some Intersection Features • Number of approaches • Skew • Proximity to horizontal/vertical curves • Number of approach lanes • Signal timing • Proximity to railroad crossing • Traffic control devices • Presence of street lighting • Presence of commercial developments Element 1, Step 1: Identify Target Crash Types & Risk Factors
Element 1: Step 1 Element 1, Step 1: Identify Target Crash Types & Risk Factors
Element 1: Step 1, Task 1Select Focus Crash Type(s) Purpose: • Identify the greatest potential to reduce fatalities and severe injuries. Suggestion: • Identify crash type(s) representing the greatest number of severe crashes across system. Element 1: Step 1, Task 1
Element 1: Step 1, Task 1Select Focus Crash Type(s) • Why is it important to select a focus crash type(s)? • There is no single countermeasure that is effective at addressing all crash types. Identifying a focus crash type(s) will help narrow down the list of countermeasures. • Q: • A: Element 1: Step 1, Task 1
Element 1: Step 1, Task 1Select Focus Crash Type(s) Resources: • State or regional SHSP • AASHTO’s 22 Emphasis Areas • Roadway Departure or Intersection Safety Implementation Plans • Other applicable safety plans • Statewide and regional crash data Element 1: Step 1, Task 1
Element 1: Step 1, Task 1Select Focus Crash Type(s) Process: • Reference emphasis areas defined in approved safety plans (State SHSP). • Stratify crash data into emphasis areas. • Select focus crash type(s): • Emphasis areas with highest frequency crashes • Priority order of emphasis areas in plans • Agency preferences Element 1: Step 1, Task 1
Statewide Data by Safety Emphasis Area Illustration: Jurisdictioncan make a difference Element 1: Step 1, Task 1
Region Data by Safety Emphasis Area Illustration: Consider impactof geography & topography Element 1: Step 1, Task 1
Element 1: Step 1, Task 1Select Focus Crash Type(s) Possible Challenges for Thurston County: • Relatively few severe crashes?…difficult to identify focus crash type(s) • Urban and rural areas have distinctly different crash patterns? Element 1: Step 1, Task 1
Element 1: Step 1, Task 2Select Focus Facilities Purpose: • Determine locations on roadway network where focus crashes occur most frequently. Element 1: Step 1, Task 2
Element 1: Step 1, Task 2 Select Focus Facilities • Why is it important to select focus facilities? • There is no single countermeasure that is appropriate for all situations. Identifying a focus facility type will help narrow down the list of countermeasures. • Q: • A: Element 1: Step 1, Task 2
Element 1: Step 1, Task 2Select Focus Facilities Resources: • Roadway Departure or Intersection Safety Implementation Plans • Statewide and regional crash data Process: • Develop crash tree diagram. • Utilize diagram to identify and select focus facilities. Element 1: Step 1, Task 2
Greater Minnesota Crash Tree Diagram Source: MnCMAT Crash Data, 2006-2010 Severe is fatal and serious injury crashes (K+A). 5 Year Crashes 156,182 4,902 -Region’s 1, 2, 3, 4, 6, 7, and 8 – NO Metro Example All – % Severe – % CSAH/CR 36,716 – 24% 1,963 – 40% State System 70,808 – 45% 2,000 – 41% City, Twnshp, Other 48,658 – 31% 939 – 19% Urban 14,086 – 38% 337 – 17% Rural 22,630 – 62% 1,626 – 83% Not Animal 18,616 – 82% 1,566 – 96% Animal 4,009 – 18% 60 – 4% Unknown/Other 1,577 – 11% 17 – 5% Not Inters-Related 5,177 – 37% 175 – 52% Inters-Related 7,332 – 52% 145 – 43% Unknown/Other 1,276 – 7% 61 – 4% Inters-Related 5,487 – 29% 463 – 30% Not Inters-Related 11,849 – 64% 1,042 –66% Run Off Road – 1,202 (23%), 69 (39%) Head On – 366 (7%), 27 (15%) “Other” – 540 (10%), 25 (14%) Rear End – 1,336 (26%), 17 (10%) Other/Unknown 2,600 – 47% 228 – 49% Signalized 209 – 4% 4 – 1% All Way Stop 164 – 3% 15 – 3% Thru-Stop 2,511 – 46% 216 – 47% Head On, SS Opp. 751 – 6% 132 – 13% Run off Road 7,891 – 67% 675 – 65% Signalized 2,308 – 31% 32 – 22% All Way Stop 445 – 6% 5 – 3% Thru-Stop 2,697 – 37% 65 – 45% Other/Unknown 1,881 – 26% 43 – 30% Run Off Road – 999 (38%), 95 (42%) Right Angle – 268 (10%), 39 (17%) “Other” – 303 (12%), 29 (13%) Head On – 112 (4%), 21 (9%) On Curve 247 – 33% 46 – 35% On Curve 3,222 – 40% 339 – 50% Right Angle – 633 (27%), 15 (47%) Rear End – 799 (35%), 5 (16%) Left Turn – 375 (16%), 5 (16%) Head On – 100 (4%), 4 (13%) Right Angle – 1,268 (47%), 37 (86%) “Other” – 252 (9%), 9 (21%) Left Turn – 268 (10%), 4 (9%) Rear End – 333 (12%), 3 (7%) Right Angle – 849 (34%), 122 (56%) “Other” – 464 (18%), 33 (15%) Run Off Road – 342 (14%), 21 (10%) Left Turn – 184 (7%), 10 (5%) Element 1: Step 1, Task 2
Element 1: Step 1, Task 2Select Focus Facilities • Suggest Minimum Crash Tree Combinations: • Location (urban / rural) • Ownership (state and local) • Segment or intersection • Segment type (freeway, multilane, two-lane, one-way) • Intersection control type (signal, stop, yield) • Additional Crash Tree Combinations: • Tangent or curve • High- or low-speed • Presence of street lighting • District or regions Element 1: Step 1, Task 2
Element 1: Step 1, Task 3Identify and Evaluate Risk Factors Purpose: Document the most common characteristics of the crash locations to further define the facility types selected from the crash tree in Step 1, Task 2. Element 1: Step 1, Task 3
Element 1: Step 1, Task 3Identify and Evaluate Risk Factors • Why are risk factors needed? • Risk factors help differentiate which locations may have the greatest potential for a future focus crash type. • These locations become the priority for where to deploy countermeasures. • Q: • A: Element 1: Step 1, Task 3
Element 1: Step 1, Task 3Identify and Evaluate Risk Factors Resources: • Crash data at statewide and regional levels • Road and intersection data • Highway Safety Manual • FHWA’s Crash Modification Factor Clearinghouse • Published research documenting the effectiveness of strategies Element 1: Step 1, Task 3
Element 1: Step 1, Task 3Identify and Evaluate Risk Factors Process: • Determine potential risk factors considering: • Ability to indicate greater potential for a future severe focus crash type • Availability of data element in existing databases or the ability to quickly gather data if not already available • Quality of data element if contained in existing databases • Applicability of data element to focus crash type and facility type Element 1: Step 1, Task 3
Element 1: Step 1, Task 3Identify and Evaluate Risk Factors Process: 2. Evaluate potential risk factors for a relationship to future crash potential: • Formal statistical analysis to determine if risk factor associated with crash frequency • Compare proportions…proportion of all locations with the characteristic versus proportion severe crash locations with (descriptive statistics) • Review published research to identify Crash Modification Factors 3. Select risk factors. Element 1: Step 1, Task 3
Evaluation of Segment Traffic Volume as Potential Risk Factor Element 1: Step 1, Task 3
Evaluation of Curve Radius as Potential Risk Factor Element 1: Step 1, Task 3
Evaluation of Access Density as Potential Risk Factor Element 1: Step 1, Task 3