Download
1 / 20
210 likes | 390 Vues
Research on the Cascading Failure of Scale-free Networks Based-on the Coupling Coefficient. Yuhua Liu, Meirong Zheng, Kaihua Xu, Wenwen Dai. Department of Computer Science Huazhong Normal University Wuhan, China Email:yhliu@mail.ccnu.edu.cn. Outline. Introduction Research Background

E N D
Research on the Cascading Failure of Scale-free Networks Based-on the Coupling Coefficient Yuhua Liu, Meirong Zheng, Kaihua Xu, Wenwen Dai Department of Computer Science Huazhong Normal University Wuhan, China Email:yhliu@mail.ccnu.edu.cn
Outline • Introduction • Research Background • Building the model of cascading failure • The analysis of the model of cascading failure • The initial stage • The method of the re-distribution of the load on the collapsed nodes • The Additional load • The Analysis of The Model of Cascading Failure Based on Coupling Coefficient • Conclusions
Introduction • As human society becomes more networked, people request a growing number of requirements about the security and reliability about the complex network which is related to the national economy, and also have made a lot of effort. • The cascading failure is produced by one or a few key nodes or edges failures, coupled by the relationship between nodes is also caused by failure to the other nodes, resulting in the chain reactions, eventually led to some node or even the collapse of the entire network.
Research Background(1/3) • The attack strategies about the scale-free network • The existing models of cascading failure • the Load-Capacity Model • the Binary Influence Model • The defects of these models • on the one hand, getting the global information is very difficult; • on the other hand, it is too simple to define the load on the node solely based on the degree of the node itself.
Research Background(2/3) • Precisely, as a part of the network nodes or edges collapsed because of overloading, through the coupling relationship of them the load re-distributed on the other nodes or edges, and then lead to the failure of other nodes or edges, the last caused a chain reaction,this mean the cascading failure.
Research Background(3/3) • In fact, most of the reality network, on the one hand, getting the global information is very difficult, and on the other hand, it is too simple to define the load on the node solely based on the degree of the node itself. Therefore, the search for a more effective method of the load distribution and a more practical way to the load re-distribution is essential.
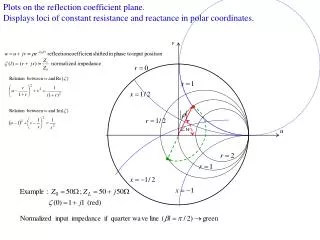
Building the model of cascading failure(1/2) In figure l, the initial load on the node not only associated with itself, but also impacted by its neighbor-nodes: Figure 1 the reference of the load on the node and its neighbor-nodes
Building the model of cascading failure(2/2) • This paper uses a cascading failure model which followed the principle of that the load on the collapse nodes is re-distributing locally and preferred, to analysis the cascading failure of the scare-free network which is based on the coupling coefficient: , mainly focused on the removal of some nodes or local dynamic properties which caused by network failure, namely the phenomenon of local cascading failure.
The initial stage In the network G (V, E) ,defined the load of Node at the initial time:
The method of the re-distribution of the load on the collapsed nodes(1/2) The re-distribution of the load on the collapsed nodes may lead to overloading on the peripheral nodes or edges
The method of the re-distribution of the load on the collapsed nodes(2/2) The load of the collapsed Node will be re-distributed to its neighbor-nodes as following probability:
The Additional load Define the node capacity of Node is directly proportional to its initial load :
The analysis of the model of cascading failure(1/4) To measure the destroy degree of the network, we choose the ability of failure-resistant and the connectivity of the network after the cascading failure. • When , indicating that the network is tending to keep perfectly; when indicating that the network is tending to crumbling. • The smaller the value of is, indicating that the stronger failure-resistant ability of the network.
The analysis of the model of cascading failure(2/4) Figure 3 (a) the ability of failure-resistant map of the two kinds of network when attacking the big-degree nodes
The analysis of the model of cascading failure(3/4) Figure 3 (b) the ability of failure-resistant map of the two kinds of network when attacking the small-degree nodes
The analysis of the model of cascading failure(4/4) Figure 4 the comparison chart of the impact on the connectivity of the two kinds of networks under the two kinds of attack strategies
Conclusions(1/3) • the paper put forward a new cascading failure model with the adjustable parameters; and analyzed the impact on the BA net and BA-S net which was led by two different attack strategies, under the new guidance of the ability of failure-resistant and the connectivity of the network.
Conclusions(2/3) • It is generally acknowledged that attacking the big-degree nodes will make a greater impact on the network, oppositely, in the BA-S model when parameter within a certain range, as illustrated in Figure 5, by numerical simulation we find that it is worse when the small-degree nodes were attacked.
Conclusions(3/3) Figure 5 the load re-distribution diagram when a big-degree nodes and a small- degree node is collapsed after being attacked