Download
1 / 62
620 likes | 749 Vues
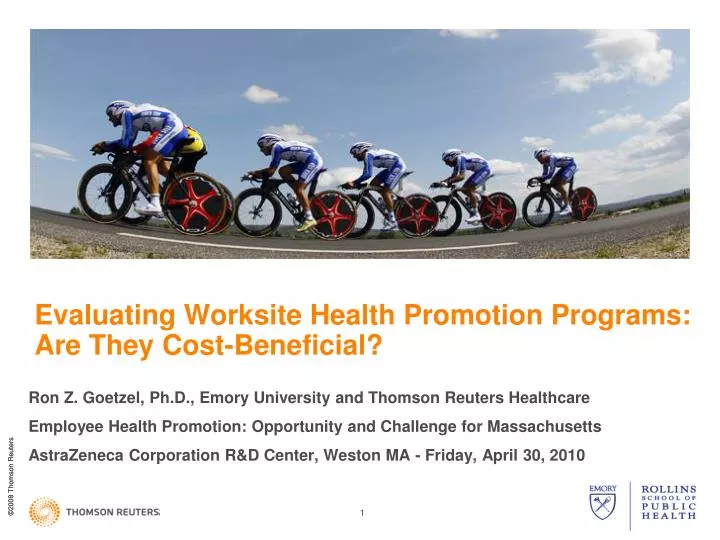
Evaluating Worksite Health Promotion Programs: Are They Cost-Beneficial?. Ron Z. Goetzel, Ph.D., Emory University and Thomson Reuters Healthcare Employee Health Promotion: Opportunity and Challenge for Massachusetts AstraZeneca Corporation R&D Center, Weston MA - Friday, April 30, 2010.

E N D
Evaluating Worksite Health Promotion Programs:Are They Cost-Beneficial? Ron Z. Goetzel, Ph.D., Emory University and Thomson Reuters Healthcare Employee Health Promotion: Opportunity and Challenge for Massachusetts AstraZeneca Corporation R&D Center, Weston MA - Friday, April 30, 2010
U.S. BUSINESS CONCERNS ABOUT HEALTHCARE • The United States spent $2.24 trillion in healthcare in 2007, or $7,421 for every man, woman and child. • Private employers contributed 77% to health insurance premiums, a 6.1% increase over 2006 • Private sector share of total spending is 53.7% • National health expenditure growth trends are expected to average about 6.6% per year through 2015. • Health expenditures as percent of GDP: • 7.2 % in 1970 • 16.2 % 2007 • 19.7 % in 2017 (est) • 25.0 % by 2030 (est) Source: Hartman et al., Health Affairs, 28:1, Jan/Feb, 2009, 246.
Ken Thorpe WHY IS HEALTH CARE SO EXPENSIVE? Rise in spending for treated diseases (37%) • Innovation/advancing technology (pharmacologic, devices, treatments) • Newborn delivery costs – five-fold increase from 1987-2002 • NICU, incubators, ventilators, C-sections • New/better medicines for treating disease • Depression (SSRI introduction – 45% treated in 1987 to 80% treated in 1997 • Allergies (Claritan, Allegra, …) • New treatment thresholds • Blood pressure • High blood glucose • Hyperlipidemia Source: K.E. Thorpe, "The Rise in Health Care Spending and What to Do About It," Health Affairs 24, no. 6 (2005): 1436-1445; and K.E. Thorpe et al., "The Impact of Obesity on Rising Medical Spending," Health Affairs 23, no. 6 (2004): 480-486.
WHY IS HEALTH CARE SO EXPENSIVE? (THORPE - PART 2) Rise in the prevalence of disease (63%) • About ¾ of all health care spending in the U.S. is focused on patients who have one or more chronic health conditions • Chronically ill patients only receive 56% of clinically recommended preventive health services • And 27% of the rise in healthcare costs is associated with increases in obesity rates…
ENVIRONMENTAL CORRELATES OF OBESITY • More driving • Rise in car ownership • Increase in driving shorter distances • Less walking and bicycling • At home, more convenience • Increase use of “labor saving” devices • Increase in ready-made foods • Increase in television viewing, computers, and video games • At work • Sedentary occupational fields (“knowledge workers”) • In public • More elevators, escalators, automatic doors and moving sidewalks
AWAY-FROM-HOME FOOD CONSUMPTION HAS DOUBLED Share of total food expenditures Calories Consumed Source: Food Consumption (per capita) Data Sysytem, USDA, Economic Research Service
LEADING CAUSES OF DEATH IN THE U.S. (2000)* *Source:Mokdad et al., JAMA,291:10, March, 2004
% OF ADULT POPULATION TREATED, BY MEDICAL CONDITION 1987-2005: RAPID RISE IN DISEASE PREVALENCE Source: ????
DISEASES CAUSED (AT LEAST PARTIALLY)BY LIFESTYLE • Obesity: Cholesystitis/Cholelithiasis, Coronary Artery Disease, Diabetes, Hypertension, Lipid Metabolism Disorders, Osteoarthritis, Sleep Apnea, Venous Embolism/Thrombosis, Cancers (Breast, Cervix, Colorectal, Gallbladder, Biliary Tract, Ovary, Prostate) • Tobacco Use: Cerebrovascular Disease, Coronary Artery Disease, Osteoporosis, Peripheral Vascular Disease, Asthma, Acute Bronchitis, COPD, Pneumonia, Cancers (Bladder, Kidney, Urinary, Larynx, Lip, Oral Cavity, Pharynx, Pancreas, Trachea, Bronchus, Lung) • Lack of Exercise: Coronary Artery Disease, Diabetes, Hypertension, Obesity, Osteoporosis • Poor Nutrition: Cerebrovascular Disease, Coronary Artery Disease, Diabetes, Diverticular Disease, Hypertension, Oral Disease, Osteoporosis, Cancers (Breast, Colorectal, Prostate) • Alcohol Use: Liver Damage, Alcohol Psychosis, Pancreatitis, Hypertension, Cerebrovascular Disease, Cancers (Breast, Esophagus, Larynx, Liver) • Stress, Anxiety, Depression: Coronary Artery Disease, Hypertension • Uncontrolled Hypertension: Coronary Artery Disease, Cerebrovascular Disease, Peripheral Vascular Disease • Uncontrolled Lipids: Coronary Artery Disease, Lipid Metabolism Disorders, Pancreatitis, Peripheral Vascular Disease
ACTUAL CAUSES OF DEATH IN THE U.S. (2000) in thousands Source: Mokdad, et al
BOTTOM LINE: THE VAST MAJORITY OF CHRONIC DISEASE CAN BE PREVENTED OR BETTER MANAGED • The Centers for Disease Control and Prevention (CDC) estimates… • 80% of heart disease and stroke • 80% of type 2 diabetes • 40% of cancer • …could be prevented if only Americans were to do three things: • Stop smoking • Start eating healthy • Get in shape
CONVINCE ME… Why should an employer (or government) invest in the health and well-being of workers?
IT SEEMS SO LOGICAL… …if you improve the health and well being of your employees… …quality of life improves …healthcare utilization is reduced …disability is controlled …productivity is enhanced
Many modifiable health risks are associated with increased health care costs and diminished productivity within a relatively short time window. Modifiable health risks can be improved through effective health promotion and disease prevention programs. Improvements in the health risk profile of a population can lead to reductions in health costs and improvements in productivity. Well-designed and well-implemented programs can be cost/beneficial – they can save more money than they cost, thus producing a positive return on investment (ROI). 1 A large proportion of diseases and disorders from which people suffer is preventable Modifiable health risk factors are precursors to many diseases and disorders, and premature death. 2 3 4 5 6 THE LOGIC FLOW
THE EVIDENCE • A large proportion of diseases and disorders is preventable. Modifiable health risk factors are precursors to a large number of diseases and disorders and to premature death (Healthy People 2000, 2010, Amler & Dull, 1987, Breslow, 1993, McGinnis & Foege, 1993, Mokdad et al., 2004) • Many modifiable health risks are associated with increased health care costs within a relatively short time window (Milliman & Robinson, 1987, Yen et al., 1992, Goetzel, et al., 1998, Anderson et al., 2000, Bertera, 1991, Pronk, 1999) • Modifiable health risks can be improved through workplace sponsored health promotion and disease prevention programs (Wilson et al., 1996, Heaney & Goetzel, 1997, Pelletier, 1999) • Improvements in the health risk profile of a population can lead to reductions in health costs (Edington et al., 2001, Goetzel et al., 1999) • Worksite health promotion and disease prevention programs save companies money in health care expenditures and produce a positive ROI (Johnson & Johnson 2002, Citibank 1999-2000, Procter and Gamble 1998, Chevron 1998, California Public Retirement System 1994, Bank of America 1993, Dupont 1990, Highmark, 2008)
POOR HEALTH COSTS MONEY • Drill Down… • Medical • Absence/work loss • Presenteeism • Risk factors
TOP 10 PHYSICAL HEALTH CONDITIONS Medical, Drug, Absence, STD Expenditures (1999 annual $ per eligible), by Component (in thousands) Source: Goetzel, Hawkins, Ozminkowski, Wang, JOEM 45:1, 5–14, January 2003.
THE BIG PICTURE: OVERALL BURDEN OF ILLNESS BY CONDITION Using Average Impairment and Prevalence Rates for Presenteeism ($23.15/hour wage estimate) (in thousands) Source: Goetzel, Hawkins, Ozminkowski, Wang, JOEM 45:46:4, April 2004.
INCREMENTAL IMPACT OF TEN MODIFIABLE RISK FACTORS ON MEDICAL EXPENDITURES Percent Difference in Medical Expenditures: High-Risk versus Lower-Risk Employees Independent effects after adjustment N = 46,026 Source: Goetzel RZ, Anderson DR, Whitmer RW, Ozminkowski RJ, et al., Journal of Occupational and Environmental Medicine 40 (10) (1998): 843–854.
EXAMINING RISK FACTORS AND PRESENTEEISM - NOVARTIS *Indicates a Statistical Significant difference between those with risk and those without risk. 21
PEPSI BOTTLING GROUP - OVERWEIGHT/OBESE ANALYSIS *At least one difference significant at the 0.05 level Diff = 25%, $987 Diff = 29%, $613* Diff = 26%, $186* Diff = 7%, $49 Diff = 58%, $111* Diff = 10%, $28 74% of the sample is overweight or obese Difference between combined overweight/obese categories and normal weight is displayed Source: Henke RM, Carls GS, Short ME, Pei X, Wang S, Moley S, Sullivan M, Goetzel RZ. The Relationship between Health Risks and Health and Productivity Costs among Employees at Pepsi Bottling Group. J Occup Environ Med. In Press.
ESTIMATED ANNUAL COSTS OF HEALTHCARE UTILIZATION, ABSENTEEISM, AND PRESENTEEISM BY BMI CATEGORY * P < .05 Source: Goetzel RZ, Gibson TB, Short ME, Chu BC, Waddell J, Bowen J, Lemon SC, Fernandez ID, Ozminkowski RJ, Wilson MG, DeJoy DM. A Multi-Worksite Analysis of the Relationships among Body Mass Index, Medical Utilization and Worker Productivity. Journal of Occupational and Environmental Medicine.In press.
Quiz: How many Americans lead healthy lifestyles? • Non-smokers • Healthy weight (BMI of 18.5-25.0) • Consume 5+ fruits/vegetable per day • Exercise regularly (30 min – 5 days/week) Bottom Line: practice healthy lifestyle across all four categories
Results: • Non smokers: 76% • Healthy weight (BMI of 18.5-25.0): 40% • Consume 5+ fruits/vegetable per day: 23% • Exercise regularly (30 min – 5 days/week): 22% All of the above: 3% Source: Reeves & Rafferty, Healthy lifestyle characteristics among adults in the U.S., 2000, Archives of Internal Medicine, 2005;165:854-857. BRFSS 2000 data, N=153,000.
OUTCOMES OF MULTI-COMPONENT WORKSITE HEALTH PROMOTION PROGRAM • Purpose: Critically review evaluation studies of multi-component worksite health promotion programs. • Methods: Comprehensive review of 47 CDC and author generated studies covering the period of 1978-1996. • Findings: • Programs vary tremendously in comprehensiveness, intensity & duration. • Providing opportunities for individualized risk reduction counseling, within the context of comprehensive programming, may be the critical component of effective programs. Literature Review Ref: Heaney & Goetzel, 1997, American Journal of Health Promotion, 11:3, January/February, 1997
EVALUATION OF WORKSITE HEALTH PROMOTION PROGRAMS — FEBRUARY 2007 ANALYSIS Worksite Health Promotion Team Robin Soler, PhD David Hopkins, MD, MPH Sima Razi, MPH Kimberly Leeks, PhD, MPH Matt Griffith, MPH
CDC COMMUNITY GUIDE TO PREVENTIVE SERVICES REVIEW – FEBRUARY 2010
PROGRAM EVALUATION:CRITICAL STEPS TO SUCCESS Financial ROI Reduced Utilization Risk Reduction Behavior Change Improved Attitudes Increased Knowledge Participation Awareness
CITIBANK, N.A.HEALTH MANAGEMENT PROGRAM EVALUATION TITLE Citibank Health Management Program (HMP) INDUSTRY Banking/Finance TARGET POPULATION 47,838 active employees eligible for medical benefits • A comprehensive multi-component health management program • Aims to help employees improve health behaviors, better manage chronic conditions, and reduce demand for unnecessary and inappropriate health services, • And, in turn, reduce prevalence of preventable diseases, show significant cost savings, and achieve a positive ROI. DESCRIPTION • Ozminkowski, R.J., Goetzel, R.Z., Smith, M.W., Cantor, R.I., Shaunghnessy, A., & Harrison, M. (2000). The Impact of the Citibank, N.A., Health Management Program on Changes in Employee Health Risks Over Time. JOEM, 42(5), 502-511. • Ozminkowski, R.J., Dunn, R.L., Goetzel, R.Z., Cantor, R.I., Murnane, J., & Harrison, M. (1999). A Return on Investment Evaluation of the Citibank, N.A., Health Management Program. AJHP, 44(1), 31-43. CITATIONS
PROGRAM COMPONENTSHIGH-RISK PROGRAM Questionnaire 1 (Program Entry and Channeling beginning January 1994 80% Low Risk 20% High Cost Risk Timeline (months) Letter/Report 1 High-Risk Letter/Report 1 Books, Audiotapes, Videotapes High-Risk Questionnaire Letter/Report 2 Books, Audiotapes, Videotapes 3 MONTHS Self-Care Materials High-Risk Questionnaire Letter/Report 3 Books, Audiotapes, Videotapes 6 MONTHS High-Risk Questionnaire Letter/Report 4 Books, Audiotapes, Videotapes 9 MONTHS
PROGRAM PARTICIPATION 47,838 54.3% All 47,838 active employees were eligible to participate. The participation rate was 54.3 percent. $10 3,000 Participants received a $10 credit for Citibank’s Choices benefit plan enrollment for the following year. Approximately 3,000 employees participated in the high risk program each year it was offered.
CITIBANK RESULTS Percent of Program Participants at High Risk at First and Last HRA by Risk Category (N=9,234 employees tracked over an average of two years) Source: Ozminkowski, R.J., Goetzel, R.Z., et al., Journal of Occupational and Environmental Medicine 42: 5, May, 2000, 502–511.
CITIBANK RESULTS Impact of improvement in risk categories on medical expenditures per month *Net Improvement refers to the number of categories in which risk improved minus number of categories in which risk stayed the same or worsened. **Impact = change in expenditures for net improvers minus change for others. Negative values imply program savings, since expenditures did not increase as much over time for those who improved, compared to all others † p < 0.05, ‡ p < 0.01
Citibank Medical Population Adjusted Mean Net Payments for the Pre- and Post-HRA periods CITIBANK: MEDICAL SAVINGS-ADJUSTED MEAN NET PAYMENTS Total savings associated with program participation for 11,219 participants over an average of 23 months post-HRA is $8,901,413* * Based on $34.03 savings and 23.31054 months post-HRA for 11,219 participants
PROGRAM COSTS PROGRAM BENEFITS PROGRAM SAVINGS $1.9 million* $8.9 million* $7.0 million* CITIBANK HEALTH MANAGEMENT PROGRAM ROI ROI = $4.7 in benefits for every $1 in costs Notes: 1996 dollars @ 0 percent discount. Slightly lower ROI estimates after discounting by either 3% or 5% per year.
JOHNSON & JOHNSONHEALTH AND WELLNESS PROGRAM EVALUATION TITLE J & J Health and Wellness Program (H & W) INDUSTRY Healthcare TARGET POPULATION 43,000 U.S. based employees • Comprehensive, multi-component worksite health promotion program • Evolved from LIVE FOR LIFE in 1979 DESCRIPTION • Goetzel, R.Z., Ozminkowski, R.J., Bruno, J.A., Rutter, K.R., Isaac, F., & Wang, S. (2002). The Long-term Impact of Johnson & Johnson’s Health & Wellness Program on Employee Health Risks. JOEM, 44(5), 417-424. • Ozminkowski, R.J., Ling, D., Goetzel, R.Z., Bruno, J.A., Rutter, K.R., Isaac, F., & Wang, S. (2002). Long-term Impact of Johnson & Johnson’s Health & Wellness Program on Health Care Utilization and Expenditures. JOEM, 44(1), 21-29. CITATIONS
LIFESTYLE BENEFIT INCENTIVE • All employees offered Health Profile • Employees assessed to be at risk for smoking, blood pressure or cholesterol were invited to participate in a health management program • Health care prices discounted by $500 • Employees not participating in Health Profile or follow-up health improvement program lose the $500 discount • Result: 94% Participation Rate
HEALTH & WELLNESS PROGRAM IMPACT ON EMPLOYEE HEALTH RISKS (N=4,586) After an average of 2¾ years, risks were reduced in eight categories but increased in four related categories: body weight, dietary fat consumption, risk for diabetes, and cigar use. High Risk Group
JOHNSON & JOHNSON HEALTH & WELLNESS PROGRAM IMPACT ON MEDICAL COSTS $225 Annual Medical Savings/ Employee/Year since 1995 Source: Ozminkowski et al, 2002 — N=18,331
Per Employee Per Year, 1995 – 1999 --Weighted by sample sizes that range from N = 8,927 – 18,331, depending upon years analyzed INFLATION-ADJUSTED, DISCOUNTED HEALTH AND WELLNESS PROGRAM CUMULATIVE SAVINGS Years Post Implementation
PROCTER & GAMBLE Total Annual Medical Costs For Participants and Non-Participants In Health Check (1990 - 1992) Adjusted for age and gender; Significant at p < .05 *In year 3 participant costs were 29% lower producing an ROI of 1.49 to 1.00 Source: Goetzel, R.Z., Jacobson, B.H., Aldana, S.G., Vardell, K., and Yee, L. Journal of Occupational and Environmental Medicine, 40:4, April, 1998.
HIGHMARK ROI STUDY • Regional health plan with approximately 12,000 workers • Headquartered in Pittsburgh, with a major operating facility in Camp Hill, PA and other locations in Johnstown, Erie, and Williamsport, PA. • Worksite Health Promotion Program (introduced in 2002) • health risk assessments (HRAs) • online programs in nutrition, weight management and stress management • tobacco cessation programs • on-site nutrition and stress classes • individual nutrition and tobacco cessation coaching • biometric screenings • six- to twelve-week campaigns to increase fitness participation and awareness of disease prevention strategies • state-of-the-art fitness centers (Pittsburgh and Camp Hill, PA) Source: Naydeck, Pearson, Ozminkowski, Day, Goetzel. The Impact of the Highmark Employee Wellness Programs on Four-Year Healthcare Costs. JOEM, 50:2, February 2008
CHARACTERISTICS USED IN MATCHING SUBJECTS – AIM IS TO SHOW PARTICIPANTS AND NON-PARTICIPANTS ARE SIMILAR Overall Comparison CCI = Charlson comorbidity index; Group 1 comorbidity includes presence of any of these: chronic obstructive pulmonary disease, rheumatologic disease stomach ulcer or dementia, all as coded by using the Charlson index; Group 2 comorbidity includes presence of any of these: cancer, renal failure, liver disease or cirrhosis, autoimmune disease.
ANNUAL GROWTH IN NET PAYMENTS Annual growth in costs, Highmark, Inc.For matched-participants and non-participants over four years – resulting in crude savings of ~$200/employee/year Start of Program
ESTIMATED ANNUAL SAVINGS AFTER FOUR YEARS OF FOLLOW-UP — PARTICIPANTS VERSUS NON-PARTICIPANTS — ADJUSTED FOR CONFOUNDERS Participants versus Non-participants