Download
1 / 23
230 likes | 380 Vues
Flow and Shear behavior in the Edge and Scrape-off Layer in NSTX L-Mode Plasmas. Y. Sechrest and T. Munsat University of Colorado at Boulder S. J. Zweben and R. J. Maqueda Princeton Plasma Physics Laboratory D. D’Ippolito , J. Myra, and D. Russell Lodestar Research Corporation.

E N D
Flow and Shear behavior in the Edge and Scrape-off Layer in NSTX L-Mode Plasmas Y. Sechrest and T. Munsat University of Colorado at Boulder S. J. Zweben and R. J. Maqueda Princeton Plasma Physics Laboratory D. D’Ippolito, J. Myra, and D. Russell Lodestar Research Corporation PPPL Monday Meeting – Sept. 20, 2010
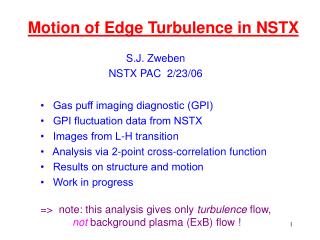
Overview What we do: Extract/Analyze estimates of 2-D velocity field from image sequences obtained by Gas Puff Imaging Purpose: Study behavior of plasma flow (2-D flow, shear, Reynolds stresses) in the NSTX edge region. • Why? • Turbulent transport: • significantly degrades confinement • Turbulence interactions with large scale (Zonal) flows • Self-generation of flow • suppression of turbulence through shearing • Explore flow organization and momentum transport in plasmas
Outline • Background • Basic flow characteristics • Quasi-periodic Turbulent bursts • Characterization of 3 kHz fluctuations • Shear, Reynolds stresses – Time permitting
Gas Puff Imaging: Basics • GPI: • images edge turbulence • manifold discharges gas puff into edge region • images visible light emission • emission complicated function of ne and Te • GPI on NSTX: • view centered 20 cm above the outboard midplane • ~ 25 cm x25 cm view • ~4 mm resolution • Dα line emission (656 nm) • 285,000 fps (3.5 μs per frame)
HOP-V Analysis: Basics • Hybrid Optical flow and Pattern-matching Velocimetry (HOP-V) • Optical Flow: • Solves continuity equation for image brightness: • assuming divergence free flow • Pattern Matching: • Subdivide image into tiles • Search for optimal displacement vector for each tile • Minimize global error function • Brightness difference • Velocity field smoothness
Time-Averaged Velocities Ion diamagnetic • Radial profiles of poloidal velocity • Fluctuation levels are comparable to size of mean flow • Vpol Shear • 10 ms time average • Cropped field to avoid edge effects • vignetting of optics • gas emission profile
Time Traces • GPI signal: • fluctuation amplitude as large as mean value • Poloidal flows: • On the order of several km/s • Large amplitude fluctuations • Bursty flow oscillations • Anti-correlated with GPI • Radial flow: • significantly smaller: 100 m/s • Large radial velocity usually associated with blobs • Blobs are spatially localized and intermittent GPI intensity (normalized), Poloidal Velocity, and Radial Velocity poloidally averaged at x = -1 cm
Quasi-Periodic Bursts R = -0.59 R = -0.61 R = -0.60 • FSOL= Fraction of Dα light in the SOL • Flow Reversals • High correlations • Periodic bursts
Spectral Characteristics • Spectrogram of FSOL • time window: 256 points (~0.9 ms) • ~1 kHz frequency resolution • Strong feature near 3 kHz • Sporadically appears between 2-4 kHz • Intermittent with duration of 1-2 ms
Phase of the ~3 kHz Mode • Phase profiles for sections of 4 shots with rotating mode. • GPI Phase: • Rapid phase change between x = -2 and x = 1 • Nearly linear poloidal phase dependence • kpol ~ 10 m-1 • Vpol Phase: • Vs. X – Mostly in phase for several centimeters. Rigid Rotation? • Vs. Y – Near linear phase dependence • kpol ~ 5 m-1
Coherence in Poloidal Direction • Coherence function and Phase vs. Frequency • Vpolsignals at x = -1 cm • separated by ~12 cm in y • 3 kHz mode: • Strong coherence peak near 3 kHz • Small phase difference • F > 10 kHz: • Coherence drops off • Phase differences become random • Turbulent
Coherence in Poloidal Direction • 3 kHz: • Maintains high coherence values over full ~12 cm • Correlation length: 56 cm • 20-30 kHz: • Background Turbulence • Correlation decays rapidly • Correlation length: 4 cm Coherence of Vpolas a function of poloidal separation for shot 135042
Radial Dependence of Spectra • Vpol spectra for shot 135042 at 3 different radii • Frequency of peak approximately constant • Amplitude significantly smaller in SOL Shot 135042, t: 240-243 ms
Recap: 3 kHz mode • What we see: • Strong mode seen intermittently in GPI, FSOL, and Vpol fluctuations • Roughly 2 kHz spreadin frequency space • Duration of 1-2 ms • Exhibits long poloidal wavelengths in both GPI, and Vpol • Long poloidal correlation lengths • - Large scale coherent flow oscillation • Vpolphase difference remains near zero over ~4 cm radial separation inside sep. • Frequency independent of radius • Amplitude of flow oscillations decays in the SOL • - Radial Size ≥ 4 cm
Possible Explanations for 3 kHz Behavior • SOLT simulations illustrated the importance of zonal flows in controlling turbulence. (Russell PoP 2009) • Shearing of flows suppress bursts • Flow damping a critical control parameter • Unclear what controls frequency of bursts • Geodesic Acoustic Mode (GAM): • Finite frequency zonal flow • n=0,m=0 velocity fluctuation – long poloidal wavelength/correlation • finite kr , propagates radially • ω = Cs/R • Refilling of plasma along field line • Loss of plasma due to bursts • Scales like V||/R • f ~ 7 kHz for Te = Ti = 50 eV, R = 1.5 m
Acknowledgements We would like to thank K. Hallatschek, and R. Hager for their communications. We would also like to acknowledge the NSTX Team for their contributions. This work was supported by US DOE Contracts #DE-FG02-08ER54995, DE- SC0001966, and DE-AC02-09CH11466. My thanks to the co-authors for their work and support. Thank you for your attention.
Shearing Rate and Reynolds Stresses • Shearing of poloidal flows predicted to modulate turbulent bursts • recent SOLT simultations illustrated this (Russell PoP 2009) • Find that shear is correlated with bursts • correlation = 0.52 • However, relationship is not simple. • Other sections don’t show high correlation • shear threshold? • low shear doesn’t always lead to burst
Shearing Rate and Reynolds Stresses • Radial profiles of Reynolds shear stresses • averaged poloidally and over 10 ms time period preceding H-mode • Similar features seen in each shot • local maximum near x = -1 cm • negative slow between x = -1 and x = 2
Phase of the ~3 kHz Mode GPI-Vpol Vpol GPI • Rapid phase change between x= -2 and x= 1 cm • Phase changes slowly in poloidal direction • Slow phase change in both directions • Mostly in phase over entire view • Cross-Phase dominated by GPI signal
Phase of the ~3 kHz Mode GPI-Vpol Vpol GPI • Rapid phase change between x= -2 and x= 1 cm • Phase changes slowly in poloidal direction • Slow phase change in both directions • Mostly in phase over entire view • Cross-Phase dominated by GPI signal