Download
1 / 20
200 likes | 288 Vues
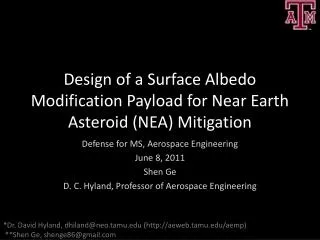
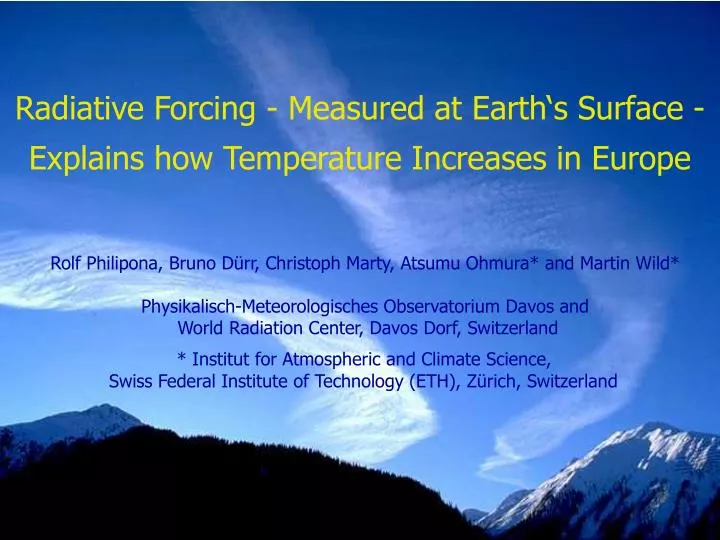
Radiative Forcing - Measured at Earth‘s Surface - Explains how Temperature Increases in Europe. Rolf Philipona, Bruno Dürr, Christoph Marty, Atsumu Ohmura* and Martin Wild* Physikalisch-Meteorologisches Observatorium Davos and World Radiation Center, Davos Dorf, Switzerland.

E N D
Radiative Forcing - Measured at Earth‘s Surface - Explains how Temperature Increases in Europe Rolf Philipona, Bruno Dürr, Christoph Marty, Atsumu Ohmura* and Martin Wild* Physikalisch-Meteorologisches Observatorium Davos and World Radiation Center, Davos Dorf, Switzerland * Institut for Atmospheric and Climate Science, Swiss Federal Institute of Technology (ETH), Zürich, Switzerland
Outline • Rapid temperature increase in central Europe • in the context of - Shortwave radiative forcing - Longwave radiative forcings - Full radiation budget - Cloud radiative forcing • Water vapor and the increasing greenhouse effect
-10° -5° Central Europe Temperature records by Phil Jones et al. 50° 45° Alpine Surface Radiation Budget Measurements
Temperature increase in Central Europe versus Northern Hemisphere 1900 - 2003 Tave (1978-1987) minus Tave (1900-1909) Tave (1994-2003) minus Tave (1978-1987) [P. Jones http://www.cru.uea.ac.uk/cru/climon/data/]
Temperature CE and NH versus Alps 1900 - 2003 1980 - 2002 1980 - 2003
ASRB - Network Alpine Surface Radiation Budget in Switzerland ANETZ Stations
Parallel shortwave downward radiation measurements at 6 collocated ANETZ / ASRB stations By MeteoSwiss with CM5 at ANETZ since 1981 By PMOD/WRC with CM21 at ASRB since 1995 Stations: Locarno-Monti, Payerne, Davos, Cimetta, Weissfluhjoch and Jungfraujoch
Temperature [ °C ] Absolute Humidity [ g m-3 ] Year Year Increase of Temperature and Humidity in the Alps 1980-2002
1981 - 2002 1995 - 2002 1981 - 2003 1995 - 2003 Rather decreasing SDR trend since 1981, except if Summer 2003 is included Decreasing shortwave downward radiation SDR
The Earth‘s annual and global mean energy budget Solar (shortwave) Radiation Thermal infrared (longwave) Radiation LOR 31% 20% SDR SNR SUR LUR 49% LDR = LDRcfr +LCE SNR = SDR - SUR [ Kiehl and Trenberth, 1997 ] THR = SNR + LDR TNR = THR – LUR Radiation budget at Earth’s surface
Radiation Budget 1995 - 2002 1995 - 2003 Longwave Cloud Effect Shortwave Downward Rad. Longwave Downward Rad. Total Heating Rad. Longwave Upward Rad. (or Temperature) Total Net Radiation
Cloud-free Longwave Downward Rad. (no Temp. incr.) LDRcf,ts well correlated with absolute humidity Very high correlation between cloud-free LDRcfr and Temperature and Humidity 1995 - 2002 1995 - 2003 Longwave Upward Rad. (or Temperature) Cloud-free Longwave Downward Rad. LDRcf highly correlated with temperature [Philipona et al., GRL, 31, 2004] [Philipona and Dürr, GRL, accepted]
The surface temperatur rise in central Europe is driven by strongly increasing cloud-free longwave downward radiation caused by a rapid increase of the greenhouse effect over land [Philipona et al., GRL, 31, 2004] [Philipona and Dürr, GRL, accepted] Conclusions Shortwave downward radiation at the surface rather decreases Clouds are increasing during the winter half year producing a longwave warming and decrease during summer half year producing a shortwave warming
Estimates of global annual-mean radiative forcings for the period from pre-industrial (1750) to present [IPCC, 2001] Can radiative forcings be measured at Earth’s surface?
Longwave Downward Rad. Shortwave Downward Rad. Longwave cloud effect LDR [Wm-2] SDR [Wm-2] LCE [Wm-2] Year Year Year Changes of Radiative Fluxes and Cloud Effect in the Alps 1995-2002
Longwave Downward Rad. cloud free Temperature Absolute Humidity LDRcf[Wm-2] u [g m-3] t [°C] Year Year Year Cloud free Longwave Downward Radiation, Temperature and Humidity
Measurements and GCM model Estimates ASRB Measurements 1995-2002 ECHAM-4 GCM Calculation for 10 % CO2 Increase LDR + 4.2 Wm-2 + 4.6 Wm-2 SDR - 1.0 Wm-2 - 1.4 Wm-2 Temperature + 0.82 °C + 0.74 °C Abs Humidity + 0.21 g m-3 + 0.20 g m-3 However, the CO2 increase from 1995 – 2002 is only 12 ppm or 3.3 % The CO2 Increase from 1980 – 2002 is 35 ppm or 10 %
Summary • Solar shortwave radiation decreases from 1981-2002 and it is therefore not the cause for the temperature increase • Clouds strongly modulate shortwave and longwave radiation but they compensate each other on the annual mean • The total heating radiation is well correlated with temperature and drives the temperature increase • The temperature increase is primarily driven by increasing cloud-free longwave radiation (very high correlation between T and LDRcf )