Download
1 / 20
220 likes | 370 Vues
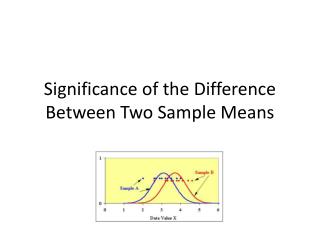
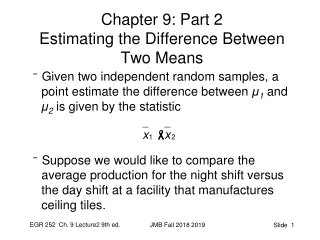
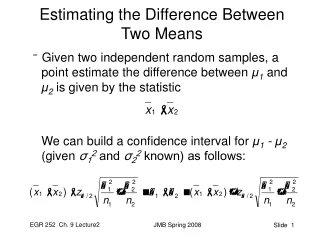
Difference Between Means. Learning Objectives. In this chapter you will learn about the t-test and its distribution t-test for related samples t-test for independent samples hypothesis testing how to use SPSS to test for differences between means. t Distribution.

E N D
Difference Between Means
Learning Objectives • In this chapter you will learn • about the t-test and its distribution • t-test for related samples • t-test for independent samples • hypothesis testing • how to use SPSS to test for differences between means
t Distribution • In Chapter 6, you were introduced to the Normal Distribution • In this chapter, we will explore another distribution • t distribution
t Distribution • If the sample size is less than 30 • use the t distribution • to calculate confidence intervals • as sample size increases • t distribution approximates the normal distribution • the shape of t distribution is not fixed
Hypothesis Testing • Hypothesis testing • based on sample evidence and probability theory • used to determine whether the hypothesis should or should not be rejected
Important Terms • Null Hypothesis • A statement about the expected value of a population parameter • Alternative Hypothesis • Research statement that is accepted • if the sample data suggest that the null hypothesis should be rejected
Type I & Type II Errors • Type I Error • Rejecting the null hypothesis when it is actually true • Type II Error () • Accepting the null hypothesis when it is actually false
Type I Errors • The chance of making a Type I error is known as the level of significance or the alpha level () • it is set by the researcher • the convention is to use the .05 level of significance as the probability of committing Type I error
The Null Hypothesis • The research hypothesis is not tested directly • Instead, we test the null hypothesis (H0): the hypothesis of no difference or no relationship • We can never prove a hypothesis to be true • Instead, we are searching for instance when it is not true
Accept or Reject? • Compare the test statistic (obtained value) to the alpha level and decide if it is greater or less than alpha • if less than, reject H0 • if greater than, retain H0
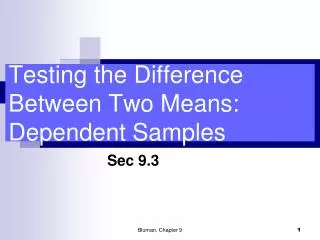
t Test • We frequently want to compare means • different tests based on sample • paired t test for related sample • independent t test when samples are not related somehow
SPSS Procedure • The following slides demonstrate the independent t test • don’t forget to • test for equality of variance • define the group either by specifying a group number (discrete variable) or by using the cut point (perhaps the median) if the variable is continuous
SPSS Step 1 Open data set
SPSS Step 2 Select Compare Means and then Independent Samples T Test
SPSS Step 3 Select the test variable and then the grouping variable
SPSS Step 4 Define the groups or use the Cut Point to divide a continuous-level variable
SPSS Step 5 Mouse Click OK to obtain results