Download
1 / 1
10 likes | 132 Vues
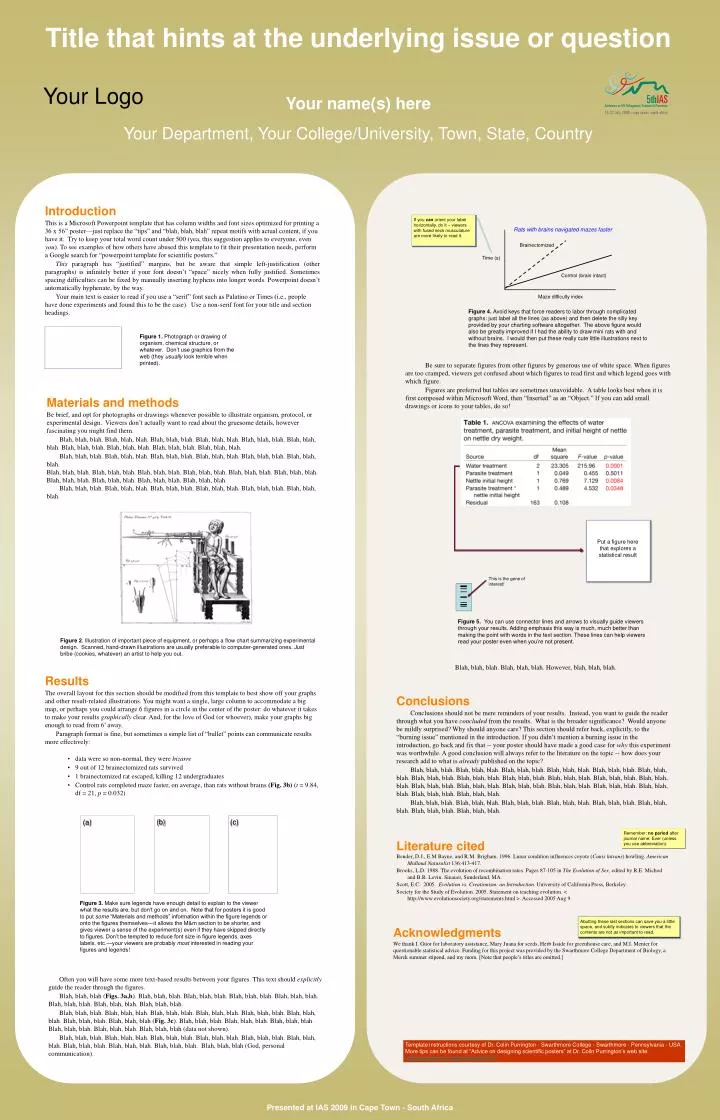
Title that hints at the underlying issue or question Your name(s) here Your Department, Your College/University, Town, State, Country. Your Logo. Introduction

E N D
Title that hints at the underlying issue or question Your name(s) here Your Department, Your College/University, Town, State, Country Your Logo Introduction This is a Microsoft Powerpoint template that has column widths and font sizes optimized for printing a 36 x 56” poster—just replace the “tips” and “blah, blah, blah” repeat motifs with actual content, if you have it. Try to keep your total word count under 500 (yea, this suggestion applies to everyone, even you). To see examples of how others have abused this template to fit their presentation needs, perform a Google search for “powerpoint template for scientific posters.” This paragraph has “justified” margins, but be aware that simple left-justification (other paragraphs) is infinitely better if your font doesn’t “space” nicely when fully justified. Sometimes spacing difficulties can be fixed by manually inserting hyphens into longer words. Powerpoint doesn’t automatically hyphenate, by the way. Your main text is easier to read if you use a “serif” font such as Palatino or Times (i.e., people have done experiments and found this to be the case). Use a non-serif font for your title and section headings. If you can orient your label horizontally, do it – viewers with fused neck musculature are more likely to read it. Rats with brains navigated mazes faster Brainectomized Time (s) Control (brain intact) Maze difficulty index Figure 4. Avoid keys that force readers to labor through complicated graphs: just label all the lines (as above) and then delete the silly key provided by your charting software altogether. The above figure would also be greatly improved if I had the ability to draw mini rats with and without brains. I would then put these really cute little illustrations next to the lines they represent. Figure 1. Photograph or drawing of organism, chemical structure, or whatever. Don’t use graphics from the web (they usually look terrible when printed). Be sure to separate figures from other figures by generous use of white space. When figures are too cramped, viewers get confused about which figures to read first and which legend goes with which figure. Figures are preferred but tables are sometimes unavoidable. A table looks best when it is first composed within Microsoft Word, then “Inserted” as an “Object.” If you can add small drawings or icons to your tables, do so! Materials and methods Be brief, and opt for photographs or drawings whenever possible to illustrate organism, protocol, or experimental design. Viewers don’t actually want to read about the gruesome details, however fascinating you might find them. Blah, blah, blah. Blah, blah, blah. Blah, blah, blah. Blah, blah, blah. Blah, blah, blah. Blah, blah, blah. Blah, blah, blah. Blah, blah, blah. Blah, blah, blah. Blah, blah, blah. Blah, blah, blah. Blah, blah, blah. Blah, blah, blah. Blah, blah, blah. Blah, blah, blah. Blah, blah, blah. Blah, blah, blah. Blah, blah, blah. Blah, blah, blah. Blah, blah, blah. Blah, blah, blah. Blah, blah, blah. Blah, blah, blah. Blah, blah, blah. Blah, blah, blah. Blah, blah, blah. Blah, blah, blah. Blah, blah, blah. Blah, blah, blah. Blah, blah, blah. Blah, blah, blah. Blah, blah, blah. Put a figure here that explores a statistical result This is the gene of interest! Figure 5. You can use connector lines and arrows to visually guide viewers through your results. Adding emphasis this way is much, much better than making the point with words in the text section. These lines can help viewers read your poster even when you’re not present. Figure 2. Illustration of important piece of equipment, or perhaps a flow chart summarizing experimental design. Scanned, hand-drawn illustrations are usually preferable to computer-generated ones. Just bribe (cookies, whatever) an artist to help you out. Blah, blah, blah. Blah, blah, blah. However, blah, blah, blah. • Results • The overall layout for this section should be modified from this template to best show off your graphs and other result-related illustrations. You might want a single, large column to accommodate a big map, or perhaps you could arrange 6 figures in a circle in the center of the poster: do whatever it takes to make your results graphically clear. And, for the love of God (or whoever), make your graphs big enough to read from 6’ away. • Paragraph format is fine, but sometimes a simple list of “bullet” points can communicate results more effectively: • data were so non-normal, they were bizarre • 9 out of 12 brainectomized rats survived • 1 brainectomized rat escaped, killing 12 undergraduates • Control rats completed maze faster, on average, than rats without brains (Fig. 3b) (t = 9.84, df = 21, p = 0.032) Conclusions Conclusions should not be mere reminders of your results. Instead, you want to guide the reader through what you have concluded from the results. What is the broader significance? Would anyone be mildly surprised? Why should anyone care? This section should refer back, explicitly, to the “burning issue” mentioned in the introduction. If you didn’t mention a burning issue in the introduction, go back and fix that -- your poster should have made a good case for why this experiment was worthwhile. A good conclusion will always refer to the literature on the topic -- how does your research add to what is already published on the topic? Blah, blah, blah. Blah, blah, blah. Blah, blah, blah. Blah, blah, blah. Blah, blah, blah. Blah, blah, blah. Blah, blah, blah. Blah, blah, blah. Blah, blah, blah. Blah, blah, blah. Blah, blah, blah. Blah, blah, blah. Blah, blah, blah. Blah, blah, blah. Blah, blah, blah. Blah, blah, blah. Blah, blah, blah. Blah, blah, blah. Blah, blah, blah. Blah, blah, blah. Blah, blah, blah. Blah, blah, blah. Blah, blah, blah. Blah, blah, blah. Blah, blah, blah. Blah, blah, blah. Blah, blah, blah. Blah, blah, blah. (b) (c) (a) Literature cited Bender, D.J., E.M Bayne, and R.M. Brigham. 1996. Lunar condition influences coyote (Canis latrans) howling. American Midland Naturalist 136:413-417. Brooks, L.D. 1988. The evolution of recombination rates. Pages 87-105 in The Evolution of Sex, edited by R.E. Michod and B.R. Levin. Sinauer, Sunderland, MA. Scott, E.C. 2005. Evolution vs. Creationism: an Introduction. University of California Press, Berkeley. Society for the Study of Evolution. 2005. Statement on teaching evolution. < http://www.evolutionsociety.org/statements.html >. Accessed 2005 Aug 9. Remember: no period after journal name. Ever (unless you use abbreviation). Figure 3. Make sure legends have enough detail to explain to the viewer what the results are, but don’t go on and on. Note that for posters it is good to put some “Materials and methods” information within the figure legends or onto the figures themselves—it allows the M&m section to be shorter, and gives viewer a sense of the experiment(s) even if they have skipped directly to figures. Don’t be tempted to reduce font size in figure legends, axes labels, etc.—your viewers are probably most interested in reading your figures and legends! Acknowledgments We thank I. Güor for laboratory assistance, Mary Juana for seeds, Herb Isside for greenhouse care, and M.I. Menter for questionable statistical advice. Funding for this project was provided by the Swarthmore College Department of Biology, a Merck summer stipend, and my mom. [Note that people’s titles are omitted.] Abutting these last sections can save you a little space, and subtly indicates to viewers that the contents are not as important to read. Often you will have some more text-based results between your figures. This text should explicitly guide the reader through the figures. Blah, blah, blah (Figs. 3a,b). Blah, blah, blah. Blah, blah, blah. Blah, blah, blah. Blah, blah, blah. Blah, blah, blah. Blah, blah, blah. Blah, blah, blah. Blah, blah, blah. Blah, blah, blah. Blah, blah, blah. Blah, blah, blah. Blah, blah, blah. Blah, blah, blah. Blah, blah, blah. Blah, blah, blah (Fig. 3c). Blah, blah, blah. Blah, blah, blah. Blah, blah, blah. Blah, blah, blah. Blah, blah, blah. Blah, blah, blah (data not shown). Blah, blah, blah. Blah, blah, blah. Blah, blah, blah. Blah, blah, blah. Blah, blah, blah. Blah, blah, blah. Blah, blah, blah. Blah, blah, blah. Blah, blah, blah. Blah, blah, blah (God, personal communication). Template instructions courtesy of Dr. Colin Purrington - Swarthmore College - Swarthmore - Pennsylvania - USA More tips can be found at “Advice on designing scientific posters” at Dr. Colin Purrington’s web site: www.swarthmore.edu/natsci/cpurrin1 Presented at IAS 2009 in Cape Town - South Africa