Download
1 / 52
520 likes | 689 Vues
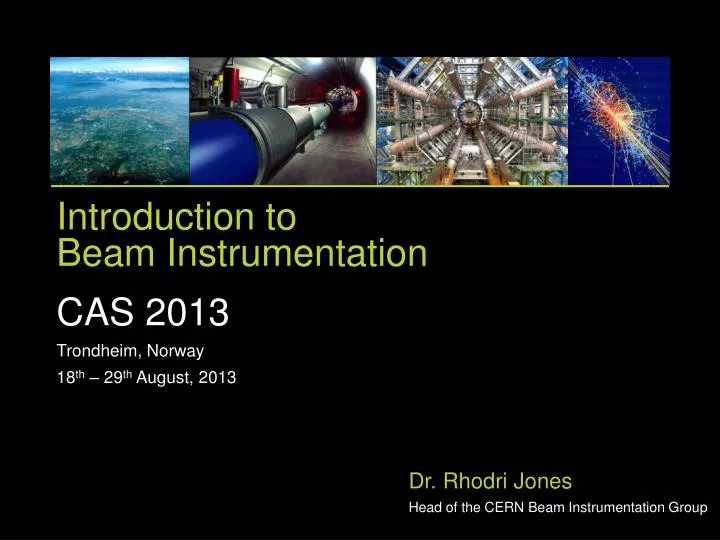
Introduction to Beam Instrumentation CAS 2013 Trondheim , Norway 18 th – 29 th August , 2013. Dr. Rhodri Jones Head of the CERN Beam Instrumentation Group. Introduction. What do we mean by beam instrumentation? The “eyes” of the machine operators

E N D
Introduction toBeam Instrumentation CAS 2013 Trondheim, Norway 18th – 29th August, 2013 Dr. Rhodri Jones Head of the CERN Beam Instrumentation Group
Introduction • What do we mean by beam instrumentation? • The “eyes” of the machine operators • i.e. the instruments that observe beam behaviour • An accelerator can never be better than the instruments measuring its performance! • What does work in beam instrumentation entail? • Design, construction & operation of instruments to observe particle beams • R&D to find new or improve existing techniques to fulfill new requirements • A combination of the following disciplines • Applied & Accelerator Physics; Mechanical, Electronic & Software Engineering • A fascinating field of work! • What beam parameters do we measure? • Beam Position • Horizontal and vertical throughout the accelerator • Beam Intensity (& lifetime measurement for a storage ring/collider) • Bunch-by-bunch charge and total circulating current • Beam Loss • Especially important for superconducting machines • Beam profiles • Transverse and longitudinal distribution • Collision rate / Luminosity (for colliders) • Measure of how well the beams are overlapped at the collision point
More Measurements QF QD QD QF QF SF SD SD SF SF Lens [Quadrupole] Optics Analogy: Focal length is energy dependent Achromatic incident light [Spread in particle energy] • Machine Chromaticity • Machine Tune Characteristic Frequency of the Magnetic Lattice Given by the strength of the Quadrupole magnets Spread in the Machine Tune due to Particle Energy Spread Controlled by Sextupole magnets
The Typical Instruments • Beam Position • electrostatic or electromagnetic pick-ups and related electronics • Beam Intensity • beam current transformers • Beam Profile • secondary emission grids and screens • wire scanners • synchrotron light monitors • ionisation and luminescence monitors • femtosecond diagnostics for ultra short bunches • Beam Loss • ionisation chambers or pin diodes • Machine Tune and Chromaticity • in diagnostics section of tomorrow • Luminosity • in diagnostics section of tomorrow
+ + + + + + + + + + + + + + + + + + + + + + + + + + + + + + + + + + + + + + + + + + + + + + + + + + + + + + + + + + + + + + + + + + + + + + + + + + + + + Measuring Beam Position – The Principle + + + + - + - + + - + - - - - - - - - - - - - - - - - + - + + + + + + + + - - - - - - + + + + + + + + - - - - - - - - + + + + + + + + + + + + + + + + - + - - + - - - - - - - - -
+ + + + + + + + + + + + + + + + + + + + + + + + + + + + + + + + + + + + + + + + + + + + + + + + + + + + + + + + + + + + + + + + + + + + + + + + + + + + + + + + + + + + + + + + + + + + + + + + + + + + + + + + + + + + + + + + + + + + + + + + + + + + + + + + + + + + + + + + + + + + + + + + + + + + + + + + + + Wall Current Monitor – The Principle V + + + - + + - + - - - - - - - - - - - + - + + + + + - - Ceramic Insert - - + + + + + - - - - - - + + + + + + + + + + + - - + - - - - - -
L Wall Current Monitor – Beam Response V R Response C IB 0 0 Frequency IB
+ + + + + + + + + + + + + + + + + + + + + + + + + + + + + + + + + + + + + + + + + + + + + + + + + + + + + + + + + + + + + + + + + + + + + + + + + + + + + Electrostatic Monitor – The Principle V + + + - + + - + - - - - - - - - - - - + - + + + + + - - - - + + + - - - - + + + + - - + - - - + - - - + - + - - - - - - - + + - - + + + - + + + + + + + + + - + - + - + - - - - - - - - +
Electrostatic Monitor – Beam Response + + + + + + + + + + + + + + + + + + + + + + + + + + + + + + + + + + + + + + + + + + + + + + + + + + + + + + + + + + + + + + + + + + + + + + + + + + + + + C Response (V) VB 0 0 Frequency (Hz) V R
+ + + + + + + + + + + + + + + + + + + + + + + + + + + + + + + + + + + + + + + + + + + + + + + + + + + + + + + + + + + + + + + + + + + + + + + + + + + + + Electrostatic Monitor – The Principle V + + + - + + - + - - - - - - - - - - - + - + + + + + - - - - + - + + - - - - + + + + - - - + - - - + - - + - + - - - - - - - - + + - - - + + + - + + + + + + + + + - + - + - + - - - - - - - - + - + + + - - + + - - - + + + - + + - - + - - - - + + + - - - - + + + + + - - - - - - - + + + + - - -
Electrostatic Pick-up – Button Area A • Low cost most popular • Non-linear • requires correction algorithm when beam is off-centre For Button with Capacitance Ce & Characteristic Impedance R0 Transfer Impedance: Lower Corner Frequency: r
A Real Example – The LHC Button Response (V) 0 Frequency (Hz) 0
Improving the Precision forNext Generation Accelerators Frequency Domain TM01 U / V TM02 f / GHz TM11 U~Q U~Qr U~Q • Standard BPMs give intensity signals which need to be subtracted to obtain a difference which is then proportional to position • Difficult to do electronically without some of the intensity information leaking through • When looking for small differences this leakage can dominate the measurement • Typically 40-80dB (100 to 10000 in V) rejection tens micron resolution for typical apertures • Solution – cavity BPMs allowing sub micron resolution • Design the detector to collect only the difference signal • Dipole Mode TM11 proportional to position & shifted in frequency with respect to monopole mode TM01 TM02 TM11 Courtesy of D. Lipka, DESY, Hamburg
Today’s State of the Art BPMs • Obtain signal using waveguides that only couple to dipole mode • Further suppression of monopole mode • Prototype BPM for ILC Final Focus • Required resolution of 2nm (yes nano!) in a 6×12mm diameter beam pipe • Achieved World Record (so far!) resolution of 8.7nm at ATF2 (KEK, Japan) Courtesy of D. Lipka, DESY, Hamburg Monopole Mode Dipole Mode Courtesy of D. Lipka & Y. Honda
Criteria for Electronics Choice -so called “Processor Electronics” • Accuracy • mechanical and electromagnetic errors • electronic components • Resolution • Stability over time • Sensitivity and Dynamic Range • Acquisition Time • measurement time • repetition time • Linearity • aperture & intensity • Radiation tolerance
Processing System Families Automatic Gain Control on S Synchronous Detection Heterodyne Multiplexed POS = (A-B) no turn by turn Homodyne Detection Hybrid D / S POS = D / S Heterodyne Electrodes A, B Differential Amplifier Individual Treatment Direct Digitisation Logarithmic Amplifiers POS = [log(A/B)] = [log(A)-log(B)] Legend: / Single channel Wide Band Narrow band Passive Normalisation Amplitude to Time Limiter, Dt to Ampl. POS = [A/B] Amplitude to Phase . Limiter, f to Ampl. POS = [ATN(A/B)] Normaliser Processor Active Circuitry D I G I T I Z E R POS = D / S turn by turn
1.5ns B + 1.5ns Beam Amplitude to Time Normalisation A B A Combiner Splitter Delay lines B Pick-up
Amplitude to Time Normalisation A + (B + 1.5ns) A B Dt depends on position B + (A + 1.5ns) A B
Advantages Fast normalisation (< 25ns) bunch to bunch measurement Signal dynamic independent of the number of bunches Input dynamic range ~45 dB No need for gain selection Reduced number of channels normalisation at the front-end ~10 dB compression of the position dynamic due to the recombination of signals Independent of external timing Time encoding allows fibre optic transmission to be used Limitations Currently reserved for beams with empty RF buckets between bunches e.g. LHC 400MHz RF but 25ns spacing 1 bunch every 10 buckets filled Tight time adjustment required No Intensity information Propagation delay stability and switching time uncertainty are the limiting performance factors BPM Acquisition ElectronicsAmplitude to Time Normaliser
What one can do with such a System Used in the CERN-SPS for electron cloud & instability studies
The Typical Instruments • Beam Position • electrostatic or electromagnetic pick-ups and related electronics • Beam Intensity • beam current transformers • Beam Profile • secondary emission grids and screens • wire scanners • synchrotron light monitors • ionisation and luminescence monitors • Femtosecond diagnostics for ultra short bunches • Beam Loss • ionisation chambers or pin diodes • Machine Tunes and Chromacitities • in diagnostics section of tomorrow • Luminosity • in diagnostics section of tomorrow
Current Transformers ri ro w Transformer Inductance Magnetic field Fields are very low Capture magnetic field lines with cores of high relative permeability (CoFe based amorphous alloy Vitrovac: μr= 105) N Turn winding Beam current
The Active AC transformer RF RL A CS R Winding of N turns and Inductance L L Beam signal Transformer output signal IB U t t
Fast Beam Current Transformer 1:40 Passive Transformer Image Current Ceramic Gap BEAM • 80nm Ti Coating • 20W to improve impedance Calibration winding • 500MHz Bandwidth • Low droop (< 0.2%/ms)
Acquisition Electronics Integrator Output 25ns FBCT Signal after 200m of Cable Data taken on LHC type beams at the CERN-SPS
What one can do with such a System Bad RF Capture of a single LHC Batch in the SPS (72 bunches)
The DC transformer • AC transformers can be extended to very low frequency but not to DC ( no dI/dt ! ) • DC measurement is required in storage rings • To do this: • Take advantage of non-linear magnetisation curve • Use 2 identical cores modulated with opposite polarities B I
DCCT Principle – Case 1: no beam B Hysteresis loop of modulator cores I Modulation Current - Core 1 Modulation Current - Core 2 IM t
DCCT Principle – Case 1: no beam B I dB/dt - Core 1 (V1) dB/dt - Core 2 (V2) Output voltage = V1 – V2 V t
DCCT Principle – Case 2: with beam B Beam Current IB I Output signal is at TWICE the modulation frequency dB/dt - Core 1 (V1) dB/dt - Core 2 (V2) Output voltage = V1 – V2 IB V t
Zero Flux DCCT Schematic Va - Vb Synchronous detector Vb Va Modulator Power supply Beam R V = R Ibeam Compensation current Ifeedback= - Ibeam
The Typical Instruments • Beam Position • electrostatic or electromagnetic pick-ups and related electronics • Beam Intensity • beam current transformers • Beam Profile • secondary emission grids and screens • wire scanners • synchrotron light monitors • ionisation and luminescence monitors • femtosecond diagnostics for ultra short bunches • Beam Loss • ionisation chambers or pin diodes • Machine Tunes and Chromacitities • in diagnostics section of tomorrow • Luminosity • in diagnostics section of tomorrow
Secondary Emission (SEM) Grids • When the beam passes through secondary electrons are ejected from the wires • The liberated electrons are removed using a polarisation voltage • The current flowing back onto the wires is measured • One amplifier/ADC chain is used for each wire
Charge density measured from each wire gives a projection of the beam profile in either horizontal or vertical plane Resolution is given by distance between wires Used only in low energy linacs and transfer lines as heating is too great for circulating beams Profiles from SEM grids
Wire Scanners + + + + + + + + + + + + + + + + + + + + + + + + + + + + + + + + + + + + + + + + + + + + + + + + + + + + + + + + + + + + + + + + + + + + + + + + + + + + + • A thin wire is moved across the beam • has to move fast to avoid excessive heating of the wire and/or beam loss • Detection • Secondary particle shower detected outside the vacuum chamber using a scintillator/photo-multiplier assembly • Secondary emission current detected as for SEM grids • Correlating wire position with detected signal gives the beam profile
Beam Profile Monitoring using Screens Beam • Optical Transition Radiation • Radiation emitted when a charged particle beam goes through the interface of 2 media with different dielectric constants • surface phenomenon allows the use of very thin screens (~10mm) OTR Screen Exit window Intensifier - CCD Mirror Lens
Beam Profile Monitoring using Screens • Screen Types • Luminescence Screens • destructive (thick) but work during setting-up with low intensities • Optical Transition Radiation (OTR) screens • much less destructive (thin) but require higher intensity
Usual configuration Combine several screens in one housing e.g. Al2O3 luminescent screen for setting-up with low intensity Thin (~10um)Ti OTR screen for high intensity measurements Carbon OTR screen for very high intensity operation Advantages compared to SEM grids allows analogue camera or CCD acquisition gives two dimensional information high resolution: ~ 400 x 300 = 120’000 pixels for a standard CCD more economical Simpler mechanics & readout electronics time resolution depends on choice of image capture device From CCD in video mode at 50Hz to Streak camera in the GHz range Beam Profile Monitoring using Screens
Luminescence Profile Monitor N2-fluorescent gas equally distributed Vacuum gauge Blackened walls Valve 150mm flange Ionbeam Viewport Beam Lens, Image-Intensifier and CCD Camera N2 excited state Photon emitted e- N2 ground state
Luminescence Profile Monitor Beam size shrinks as beam is accelerated 2D Side view Fast extraction Injection Slow extraction 3D Image CERN-SPS Measurements • Profile Collected every 20ms • Local Pressure at ~510-7Torr Time Beam Size Time Beam Size
The Synchrotron Light Monitor Synchrotron Light from Bending Magnet or Undulator Beam
Measuring Ultra Short Bunches • Next Generation FELs & Linear Colliders • Use ultra short bunches to increase brightness or improve luminosity • How do we measure such short bunches? • Transverse deflecting cavity Destructive Measurement
Electro-Optic Sampling – Non Destructive Spectral Decoding Limited to >250fs by laser bandwidth Temporal decoding Limited to >30fs by sampling laser pulse
The Typical Instruments • Beam Position • electrostatic or electromagnetic pick-ups and related electronics • Beam Intensity • beam current transformers • Beam Profile • secondary emission grids and screens • wire scanners • synchrotron light monitors • ionisation and luminescence monitors • femtosecond diagnostics for ultra short bunches • Beam Loss • ionisation chambers or pin diodes • Machine Tunes and Chromacitities • in diagnostics section of tomorrow • Luminosity • in diagnostics section of tomorrow
Role of a BLM system: Protect the machine from damage Dump the beam to avoid magnet quenches (for SC magnets) Diagnostic tool to improve the performance of the accelerator Common types of monitor Long ionisation chamber (charge detection) Up to several km of gas filled hollow coaxial cables Position sensitivity achieved by comparing direct & reflected pulse e.g. SLAC – 8m position resolution (30ns) over 3.5km cable length Dynamic range of up to 104 Fibre optic monitors Similar layout with electrical signals replaced by light produced through Cerenkov effect Beam Loss Detectors
Common types of monitor (cont) Short ionisation chamber (charge detection) Typically gas filled with many metallic electrodes and kV bias Speed limited by ion collection time - tens of microseconds Dynamic range of up to 108 Beam Loss Detectors iin(t) iin(t) + Iref LHC
Common types of monitor (cont) PIN photodiode (count detection) Detect MIP crossing photodiodes Count rate proportional to beam loss Speed limited by integration time Dynamic range of up to 109 Beam Loss Detectors HERA-p Comparator
Beam Loss Detectors – New Materials • Diamond Detectors • Fast & sensitive • Used in LHC to distinguish bunch by bunch losses • Investigations now ongoing to see if they can work in cryogenic conditions Courtesy of E. Griesmayer