Download
1 / 24
240 likes | 387 Vues
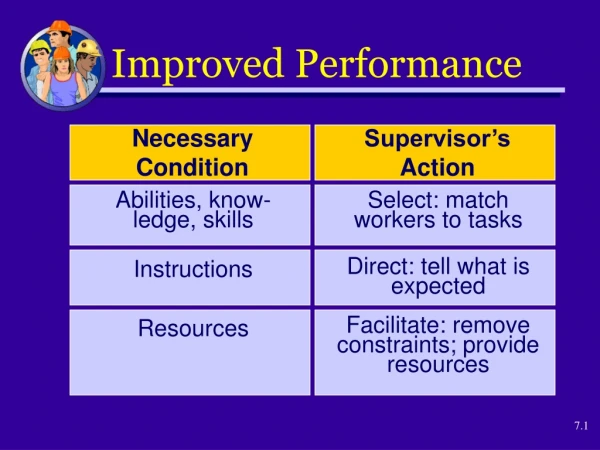
Improved Performance. 2002 2001 Change (millions) Q3 Q3 Fav./(Unfav.) Oper. Revenue $ 2,745 $2,586 $ 159 Oper. Expense 2,577 2,644 67 Oper. Income (Loss) 168 (58) 226 Non-oper. Expense 37 (111) 148 Income (Loss)

E N D
Improved Performance 2002 2001 Change(millions) Q3 Q3 Fav./(Unfav.) Oper. Revenue $ 2,745 $2,586 $ 159 Oper. Expense 2,577 2,644 67 Oper. Income (Loss) 168 (58) 226 Non-oper. Expense 37 (111) 148 Income (Loss) Before FX & Tax $ 205 $ (169) $ 374 FX on L/T Monetary Items (86) (253) 167 Income (Loss) Before Tax $ 119 $ (422) $ 541
Best Operating Results* of any Major International Carrier in North America % OPERATING MARGIN 2001 2002 * Pre-government assistance & non-recurring charges, US = 6 majors, 5 majors in Q3’02
Air Canada Revenue Recovering Faster Q3 2002/2001 % CHANGE • Better geographic diversity • Stronger markets • High load factors • Tight yield management • Brand segmentation
Air Canada’s 3rd Quarter Passenger RASM Outperforms Industry YEAR/YEAR % CHANGE 2002 2001 AC Yield + 3.2% L.F. +1.8 PP * Mainline ** Source ATA
Air Canada Unit Cost** Performance Outpaces US Industry YEAR/YEAR % CHANGE 2002 2001 * Mainline * * Adjusted for one-timers; US = 6 majors, 5 majors in Q3’02
All Expense Categories Down Except Ownership, User Fees, and Insurance YTD Sept. 2002/2001 % change Mainline
Higher Fleet ProductivityY-T-D September ASM’s* 1%, Block Hrs* 8% 2002/2001 % CHANGE ASMs Block Hours * Mainline
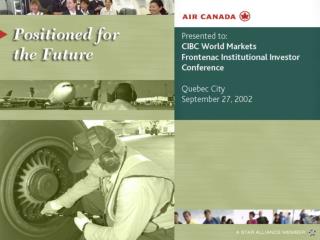
Positioned For The Future 1. Multi-brand strategy 2. Increasing employee productivity 3. Falling distribution costs 4. Fleet simplification and commonality 5. Six Sigma 6. Low cap-ex and moderate debt repayment
Air Canada’s Products - Tango • Low fare/leisure • Simplified product • Supplemental flying in key markets • Medium, long haul • Domestic, transcontinental, sun • Point to point • No interlining • Low product cost • Mainline labour cost
Underlying Tango Profitability • Revenue certainty • no overbooking, no denied boardings • No refunds • Single class seating • Low distribution costs • 80% to 90% internet bookings • Global Distribution Systems (GDS) by-pass • all e-ticket • “All frills extra” onboard service • No interlining, no baggage transfer • Fast turnaround, higher aircraft utilization • Low overhead
Air Canada’s Products - Zip • Low fare/business/ leisure • Simplified product • Domestic/transborder • Point-to-point, short haul • Full interlining • Low product cost • Low labour cost
Employee Productivity Continues To Improve ASM per EMPLOYEE** * Air Canada Pre-merger Air Canada for full year + CAIL from June 30/00 ASM = Available Seat Mile * YTD + estimate for balance of year ** Mainline
Agency Commissions Cut By More Than Half Since 1998 COMMISSIONS AS % OF PASSENGER REVENUE 9.3% 7.6% 6.6% 5.9% 4.3% * * YTD + estimate for balance of year
Narrow Body FleetMoving to all Airbus 2000 2002 CRJ 15% CRJ 16% DC-9 10% B-737 16% Airbus 49% Airbus 68% To be replaced with Airbus A319 aircraft when leases expire - some initially going to Zip. B-737 26% 167 Aircraft 157 Aircraft
2002 2003 8 MBB 15 MBB 30 BB 120 BB 320 GB 1,380 GB Implementing Six Sigma Trained Personnel Target Areas • Operations • Airports, Air Canada Technical Services, System Operations Control, Flight Ops, In-Flight Services, Call Centres, Air Canada Jazz, Aeroplan, Air Canada Vacations • Staff • Marketing, Sales, Network Planning, Human Resources, Law, IT, Purchasing, Destina.ca MBB = Master Black Belt, BB = Black Belt, GB= Green Belt
Low Cap-Ex & Moderate Debt Repayment • Cap-Ex • Annual steady state cap-ex = $150 million • 2003 & 2004 aircraft deliveries fully financed • ten A319/320/321s • two A340-500s • three A340-600s • Debt Repayment • $426 million current portion as of September 30, 2002
Good Liquidity • $0.7 billion in cash + $0.2 billion in committed financing at September 30, 2002. • Generating positive cash flow from operations. • Approximately $2.5 billion of unencumbered assets • aircraft • engines and spares • inventory • real estate • lease deposit receivables • accounts receivable
Air Canada Price Performance YTD October 2002 % change
Caution Concerning Forward-looking Information: Certain statements made in this presentation may be of a forward-looking nature and subject to important risks and uncertainties. The results indicated in these statements could differ materially from actual results for a number of reasons, including without limitation, general industry, market and economic conditions, the ability to reduce operating costs and fully integrate the operations of Canadian Airlines, employment relations, energy prices, currency exchange rates, interest rates, changes in laws, adverse regulatory developments or proceedings and pending litigation. Any forward-looking statements contained in this presentation represent Air Canada’s expectations as of November 14, 2002 and are subject to change after such date. However, Air Canada disclaims any intention or obligation to update or revise any forward-looking statements whether as a result of new information, future events or otherwise.