Download
1 / 19
190 likes | 364 Vues
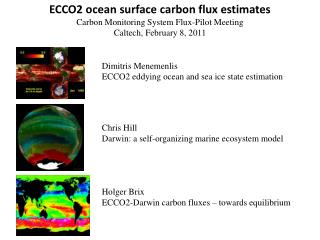
Deb Agarwal (BWC), Marty Humphrey ( Uva ), and Norm Beekwilder ( Uva ). A Data Centered Collaboration Portal to Support Global Carbon-Flux Analysis. Fluxnet Global Carbon Flux Network. Marconi Workshop – June 2000 - Marconi Conference Center, California Data from 38 sites

E N D
Deb Agarwal (BWC), Marty Humphrey (Uva), and Norm Beekwilder (Uva) A Data Centered Collaboration Portal to Support Global Carbon-Flux Analysis
Marconi Workshop – June 2000 - Marconi Conference Center, California • Data from 38 sites • ~96 site years of data • 17 half/hourly variables • 15 synthesis papers - published in a special issue of the Agriculture and Forest Meteorology, Volume 113, 2002 • La Thuile Workshop – February 2007 – La Thuile, Italy • Data from 253 sites (sensor, derived, and ancillary) • ~960 site years of data • 41 half/hourly variables • ~70 active synthesis papers underway Fluxnet Synthesis Workshops
T SOIL T AIR Onset of photosynthesis Fluxnet Collaboration data flow Measurement Site Scientists Regional Networks Quality Assess and Gap Fill Data Access and Summaries, Site Biological and Ancillary Metadata, and Collaboration Support Synthesis activities
Synthesis Collaboration interactions Steering Committee of Regional Networks Site Measurement Scientists (129) Fluxdata web site Permission to pursue synthesis activity on the data • Ancillary site data • Data usage permission • Credit/co-authorship • Contribution to analysis Synthesis Paper Teams (70) • Data access, updates, and corrections • Collaboration support • Information on other teams Quality and Gap Fill (2) • Clarification • Correction • Interpretation
Synthesis teams • Site selection and communication with site scientists • Data access (ancillary and flux/meteorological) • Data analysis support • Site Measurement Scientists • Information about and communication with synthesis teams • Correct site ancillary information • Access the FLUXNET version of site data • Public • Potential synthesis activity investigation • Funding agent verification of funding value • Modeler understanding of measurements • Updated information about the collaboration Fluxdata Portal Users/USES
Minimize the barrier to entry Focus on functionality targeted at improving the scienceexperience (get familiar with the science) Include critical content needed by a majority of collaborators Avoid adding extraneous functionality Listen to the target scientists (learn some of their science) Develop a relationship of mutual trust Anticipate changes in users’ practices due to introduction of collaborative tools Fluxdata design Philosophy
Minimize the barrier to entry • Put as much as possible in the public domain • Focus on functionality targeted at improving the science experience • Aggregate and data quality reports • Data browsing • Easy communication with measurement site scientists • Easy ability to generate typical analysis graphs • Include critical content needed by a majority of collaborators • Data download • Access to ancillary data about sites • Avoid adding extraneous functionality • Listen to the target users • Understand what is important to them • Read their papers and identify typical analyses and techniques • How they work with the data (units/time periods/etc) • Develop a relationship of mutual trust Anticipate changes in users’ practices due to introduction of collaborative tools Fluxdatadesign
Acknowledgements Berkeley Water Center, University of California, Berkeley, Lawrence Berkeley Laboratory Jim Hunt (UCB) Deb Agarwal (LBL) Robin Weber (UCB) Monte Good (LBL) Rebecca Leonardson (UCB student) Matt Rodriguez (SDSC Student) Carolyn Remick (UCB) Susan Hubbard (LBL) University of Virginia Marty Humphrey Norm Beekwilder Microsoft Catharine van Ingen Bora Beran JayantGupchup (student) Nolan Li (student) Stuart Ozer Tony Hey Dan Fay SavasParastidis Andy Sterland Jing De Jong-Chen SQL product team Jim Gray Ameriflux Collaboration Beverly Law (UOregon) YoungryelRyu (UCB postdoc) Tara Stiefl (UO student) Chris Williamson (UO student) Gretchen Miller (UCB student) Tom Boden (ORNL) North American Carbon Program Peter Thornton (ORNL) Kevin Schaefer (NSIDC) Daniel Ricciuto (ORNL) FLUXNET Collaboration Dennis Baldocchi (UCB) Rodrigo Vargas (UCB postdoc) Dario Papale (UTuscia) Markus Reichstein (Max Plank) Bob Cook (ORNL) Dorothea Frank (Max Plank) URLs: http://bwc.berkeley.edu and http://www.fluxdata.org E-mail: fluxdata-support@fluxdata.org