Download
1 / 4
50 likes | 62 Vues
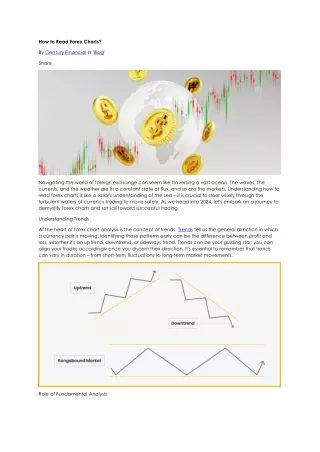
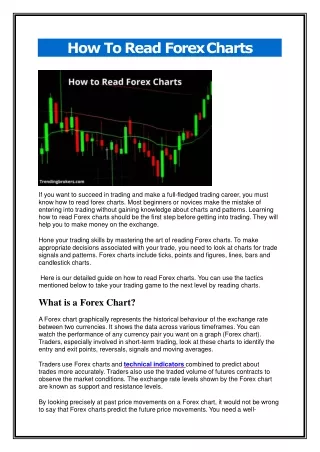
If you want to succeed in trading and make a full-fledged trading career, you must know how to read forex charts. Most beginners or novices make the mistake of entering into trading without gaining knowledge about charts and patterns. Learning how to read Forex charts should be the first step before getting into trading. They will help you to make money on the exchange.

E N D
How To Read ForexCharts If you want to succeed in trading and make a full-fledged trading career, you must know how to read forex charts. Most beginners or novices make the mistake of entering into trading without gaining knowledge about charts and patterns. Learning how to read Forex charts should be the first step before getting into trading. They will help you to make money on theexchange. Hone your trading skills by mastering the art of reading Forex charts. To make appropriate decisions associated with your trade, you need to look at charts for trade signals and patterns. Forex charts include ticks, points and figures, lines, bars and candlestick charts. Here is our detailed guide on how to read Forex charts. You can use the tactics mentioned below to take your trading game to the next level by readingcharts. What is a ForexChart? A Forex chart graphically represents the historical behaviour of the exchange rate between two currencies. It shows the data across various timeframes. You can watch the performance of any currency pair you want on a graph (Forexchart). Traders, especially involved in short-term trading, look at these charts to identify the entry and exit points, reversals, signals and movingaverages. Traders use Forex charts and technical indicators combined to predict about trades more accurately. Traders also use the traded volume of futures contracts to observe the market conditions. The exchange rate levels shown by the Forex chart are known as support and resistancelevels. By looking precisely at past price movements on a Forex chart, it would not be wrong to say that Forex charts predict the future price movements. You need awell-
regulated broker to use the charting software to serve and guide you throughout your trading journey. ROinvestingis one of the best brokers that offers world-class charting software comprising more than 30 technical indicators. It providesthe award-winning trading platforms with favourable trading conditions for itsclients. What to look for on a Forexchart? You can observe market trends and exchange rate patterns that can help you to execute various trading strategies, including scalping, day trading and swing trading. In addition, you can use several technical indicators to predict the future price movements of the trades in which you are interested. Forex charting software can easily becustomised. If you want to go for advanced technical analysis, you may wish to use Elliott Wave Theory. This theory tells us about wave patterns by looking at exchange rate movements. There are five waves that move in the direction of the trend. Three out of those five waves make the trend correction and correct the trend in Fibonacci ratios. By understanding Forex charts, it would be easy for traders to determine where to invest their funds through technical analysis. One should know how to use the forex charts to implement this technical analysis. You can use the free charting software offered by the reputed broker ROinvesting. Technical analysts believe that the current balance of buyers and sellers is more important than the fundamentals of the currencypair. Time frames andPatterns The charting software of most trading platforms offers all normal time frames from tick data to yearly data, including minutes andmonths. There are various chart patterns, including flags and pennants, gaps and channels, ranges and triangles; head and shoulder, double, triple and saucer tops and bottoms. But on a surface level, forex charts give you the results through lines, bars and candlestickcharts. In a Forex chart, the time period is generally mentioned on X-axis and the exchange rate onY-axis. Types of ForexCharts There can be different types of Forex charts. And traders can use them according to their convenience. You also can use the most suitable trading chart as per your trading style. But, of course, there is no specific categorisation of forex charts according to different tradingstyles. But choose the one and hone it. If you look at various forex charts and charting patterns at one time, you will definitely get confused. Here are the most common Forex charts that are used amongtraders.
Linecharts Bar charts Candlestick charts How to read tradingcharts Line charts The line chart is the simplest of all trading charts. It connects one closing price to another. When the closing prices are joined together, the line is formed. Line charts are relatively easy to use. One can quickly identify the entry and exit points by looking at lines as they will show you the rise and fall of the currency at a particular time. They are used to observe single exchange rates. Line charts consist mainly of closing prices only. It does not include other data. Traders use them to find overall trends or other important patterns to minimise the risks. You will see the fixed time intervals on the x-axis and the price range on they-axis. Line charts can show you the effect of short-term trends on currency pairs. For example, if you see a steep fall in the relative price of a currency pair, it indicates that it is the right time to buy the underlying currencypair. Barcharts It is slightly complex to use the bar charts. But they provide more information as compared to line charts. So traders who want no risks and carry focused research on the underlying assets can use bar charts. It is quite obvious that there are fewer chances of potential risks if you use bar chartscorrectly. Bar charts generally show exchange rate gaps. When you look at a bar chart, you will see the highs and lows for each time period. This pattern forms bars. They also have fixed time intervals mentioned on the x-axis. There are both open and close levels also on a bar chart. Bar charts are also known as HLOC charts. HLOC means High, Low, Open,Close. The vertical line you may see on a bar chart connects the high and low. You can identify the open level with a horizontal dash towards the right and close level when the horizontal dash towards theleft. Candlestick charts Candlestick charts are the advanced version of bar charts. The charting software is a Japanese invention. They also indicate highs and lows on a vertical line. But they also show you the colour of those bars or candles to signify the rise and fall of the market in a particular time interval. The vertical lines tell you about the trading ranges. You can easily opt for entry and exit points and find the open and close levels with these tradingranges.
Traders use candlestick patterns to pinpoint their entry and exit positions. The best part about these FX charts is that they can show you the blocks of range of opening and closing price. For example, white colour means bullish candle and black colour means bearishcandle. There is another term included in candlestick charts is wicks. Wicks is referred to the vertical lines between the low and the open between the high and the close. You may see both long and shortwicks. The size of the wicks tells you about certain market conditions. Traders use wicks to identify different signals and market trends to mitigate the risks and maximise the chances of higher returns on theirinvestments. By looking at candlestick charts, you can see that buyers and sellers drive the market conditions. This is a great tool to know what are the factors shaping up the marketconditions. Mountaincharts The mountain charts are quite similar to the line charts. But the major difference between line and mountain is that the area beneath the line is shaded in mountain charts. Therefore, one can efficiently conduct Forex charts analysis using a mountain chart. Reading Charts with TechnicalIndicators Forex charts can be customised according to the technical indicators. Thus, one can have a detailed understanding of currency movements on a forex chart with the help of technical indicators. There are a large number of technical indicators to predict the market conditions, but the most common and efficient ones are Bollinger bands, moving average lines and relative strength index (RSI). Several indicators are there that can become part of an automated trading system. Of course, there can be different opinions and a long debate on distinct technical indicators. But traders must choose what suits them. See what works best for you and use it for a long time to honeit. BollingerBands Bollinger bands are used to measure the volatility of the market. When the pattern in Bollinger bands comes close, it is known as a squeeze. Traders look for squeezes to enter the market with several potential opportunities to make money. Bollinger bands are a type ofoverlays. Continue Reading……