Download
1 / 2
20 likes | 35 Vues
Shopify unveiled some useful marketing facts about the online retail industry and indicated growth in the coming future. This puts direct emphasis on the increasing demand to hire an expert Shopify developer for optimized online presence. To get a quote for your store, visit:http://bit.ly/2LhFNpx

E N D
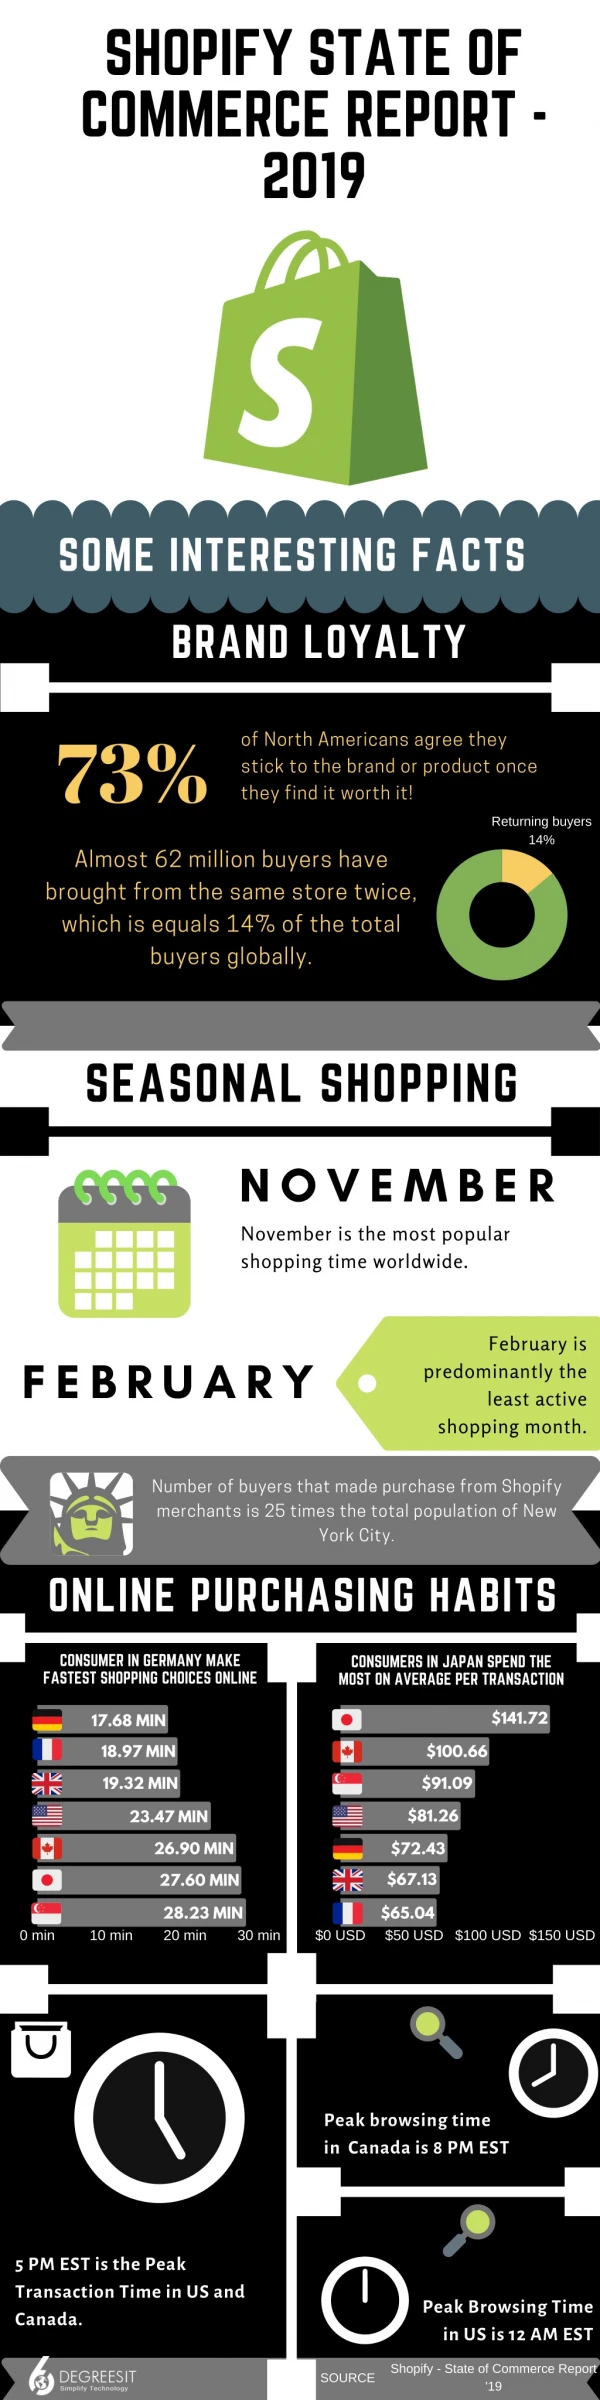
SHOPIFY STATE OF COMMERCE REPORT - 2019 SOME INTERESTING FACTS BRAND LOYALTY 73% of North Americans agree they stick to the brand or product once they find it worth it! Returning buyers 14% Almost 62 million buyers have brought from the same store twice, which is equals 14% of the total buyers globally. 86% SEASONAL SHOPPING NOVE MBER November is the most popular shopping time worldwide. February is predominantly the least active shopping month. FEBRUARY Number of buyers that made purchase from Shopify merchants is 25 times the total population of New York City. ONLINE PURCHASING HABITS CONSUMER IN GERMANY MAKE FASTEST SHOPPING CHOICES ONLINE CONSUMERS IN JAPAN SPEND THE MOST ON AVERAGE PER TRANSACTION $141.72 17.68 MIN 18.97 MIN $100.66 19.32 MIN $91.09 $81.26 23.47 MIN 26.90 MIN $72.43 $67.13 27.60 MIN 28.23 MIN $65.04 0 min 10 min 20 min 30 min $0 USD $50 USD $100 USD $150 USD Peak browsing time in Canada is 8 PM EST 5 PM EST is the Peak Transaction Time in US and Canada. Peak Browsing Time in US is 12 AM EST Shopify - State of Commerce Report '19 SOURCE
PREFERRED DEVICE On the other hand, Mexicans prefer Desktop over any other medium while making purchase online. Indians make more purchase over Desktop & Tablet in comparison to Mobile phones. US, UK, Canada, China, and people of Australia prefer all three mediums for purchasing online. MARKETING GAP FOR BUSINESS OWNERS Over 30% of merchants state that marketing is one of their biggest challenges. * Building a brand is another big challenge for nearly 22% of the merchants. * The above facts and figures are based on the data collected during Shopify Merchant Survey and covers * the globe. AVERAGE ONLINE ORDERS IN-PERSON Sales $62 ONLINE Sales $75 VS ONLINE STORE FRONTS ARE TWICE AS LINKELY TO BE THE MAIN SOURCE OF REVENUE SIGNIFICANTLY MORE NORTH AMERICANS PREFER RESEARCHING ONLINE THAN IN- STORE, BUT SIGNIFICANTLY MORE BUYERS PREFER BUYING IN-STORE THAN ONLINE. THE OMNI-CHANNEL APPROACH Shopify merchants have experienced more in-store sales with 100,000+ retailers using Shopify POS software to sell-in-person in 2018. more merchants have started using Shopify POS from 2018 to 2019. 14% SOURCE:- Shopify - State of Commerce Report '19