FRACTIONAL DISTILLATION
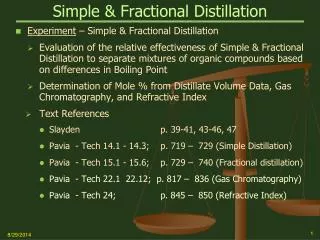
FRACTIONAL DISTILLATION. ORG I LAB Dr. W. J. KELLY. THE BOILING POINT. The Boiling Point is the temperature at which internal vapor pressure of the liquid is equal to the pressure exerted by its surroundings

FRACTIONAL DISTILLATION
E N D
Presentation Transcript
FRACTIONAL DISTILLATION ORG I LAB Dr. W. J. KELLY
THE BOILING POINT • The Boiling Point is the temperature at which internal vapor pressure of the liquid is equal to the pressure exerted by its surroundings • If the liquid is open to the atmosphere, the boiling point is the temperature at which the internal vapor pressure of the liquid becomes equal to atmospheric pressure (~760 mm Hg). • The internal vapor pressure of a pure liquid rises steadily as the temperature is increased until the boiling point is reached. • P µ e -C/T • The temperature remains constant throughout the boiling process of a pure liquid. At the boiling point, the liquid and vapor are inequilibrium...if the composition of each phase remains constant, the temperature will remain constant In a Distillation Process a liquid is heated to its boiling point, the vapors expand out of the container and are then cooled below the boiling point temperature, where they recondense as a liquid
THE TEMP/TIME RELATIONSHIP • A thermometer placed in the vapor of a boiling pure liquid registers the liquids boiling point. • The temperature remains constant throughout the boiling process of a pure liquid. At the boiling point, the liquid and vapor are inequilibrium...if the composition of each phase remains constant, the temperature will remain constant • The temperature of a liquid mixture AB, where BPA<BPB will rise steadily over time. The composition of the liquid and vapor in equilibrium changes constantly over time. At the beginning the vapor contains more A, at the end more B.
Raoult’s Law • For a mixture of two miscible liquids (A and B), the total vapor pressure is the sum of the individual vapor pressures: Ptotal = PA + PB where PA = NAliquidx P˚A And PB = NBliquid x P˚B where P˚A is the vapor pressure of pure A and P˚B is the vapor pressure of pure B and NAliquid is the mole fraction of A and NBliquid is the mole fraction of B where NAliquid = moles A/moles A + B and NBliquid = moles B/moles A +B
Vapor Enrichment • From Raoult’s Law we can obtain the following relationships: NAvapor =P˚A/PT And NBvapor =P˚B/PT • If A is more volatile than B, BPA < BPB and P˚A > P˚B Then NAvapor >NAliquid • The result of this process is that when a mixture of two miscible liquids with different boiling points is heated,the vapor will have a different composition than the liquid. THE VAPOR IS ENRICHED IN THE MORE VOLATILE (LOWER BOILING) COMPONENT.
Liquid-Vapor Composition Diagram Distillation Process • When a mixture AB of aspecific composition is heated, the total vapor pressure (composed of the contributions of PA and PB) will rise until it is equal to the external vapor pressure. The mixture will begin to boil. • The vapor which first forms is enriched in the more volatile component.This behavior is shown at right, • Assume a two component mixture with a composition of 30%A:70%B (point W). The boiling point of this mixture is found by drawing a vertical line from W to where it intersects the lower curve (point X). A horizontal line drawn from X to where it intersects the vertical axis (the temperature) gives the bp of composition W. From the point (Y) where this horizontal line intersects the upper curve (vapor) drop a vertical line to intersect the lower axis (the composition). Point Z gives the composition of the vapor which is in equilibrium with a liquid of composition W at its boiling point.
Fractional Distillation AB at composition of 5% A boils at temperature L1 and the vapors with composition V1 enter the column at that temperature. The vapor will condense to a liquid with composition V1. The condensate L2 has a lower boiling point (because it has more of the lower boiling liquid A) and will thus vaporize at a lower temperature (warmed up by coming in contact with the additional vapors from below) to give vapors of composition V2. These vapors will condense somewhat farther up the column to give a condensate L3. If the column is long enough or contains sufficient surface area that many successive vaporization-condensation steps (theoretical plates) can occur, the distillate that comes over the top is nearly pure A. Distillation yielding pure A continues until all of A is removed, after which the temperature at the thermometer rises to the boiling point of B.
The efficiency of a fractional distillation is determined by the amount of “pure” liquid components obtained. Keep in mind that if a liquid is “pure” it will have a constant boiling point. The temperature of vapors in equilibrium with liquid at the boiling point will be constant. A plot of temperature vs. time for a pure liquid will look like A below. • The efficiency of a fractional distillation can be demonstrated graphically by plotting the change in temperature of the distillate over time (or over volume of distillate, as in this experiment). In a fractional distillation with low efficiency, separation will be poor. There will be little or no “pure” component as distillate. The composition of the distillate will be constantly changing and the bp of the vapor in equilibrium with liquid will be constantly changing. It will give a plot such as B. • An efficient distillation will give pure components which will have constant boiling points. Such a process is shown below in plot C. The relatively “flat: horizontal regions at the beginning and end of the plot indicate “pure” components A and B are obtained. • The closer to this ideal sigmoid shape the better the fractional distillation. Distillation Efficiency