Download
1 / 36
410 likes | 656 Vues
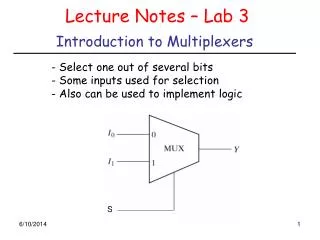
Lecture 01: Introduction. January 17, 2013 COMP 150-2 Visualization. People. Instructor: Remco Chang remco@cs.tufts.edu Office: Halligan E009 Hours: TBD. Graduate TA: Eli Brown Eli.Brown@Tufts.edu Office Hours: By appointment only. TA: Dan Kass. TA: Liz Salowtiz.

E N D
Lecture 01:Introduction January 17, 2013 COMP 150-2Visualization
People Instructor: Remco Chang remco@cs.tufts.edu Office: Halligan E009 Hours: TBD Graduate TA: Eli Brown Eli.Brown@Tufts.edu Office Hours: By appointment only TA:Dan Kass TA:Liz Salowtiz TA:Mike Borys
People • Let me get to know you guys a little bit… Show of hand: • CS Course Background • People who took COMP 11 with me… • … taken COMP 15 • … taken COMP 40 • Know Java? • Vis Programming Background • … taken COMP 175 (Graphics) • … taken COMP 171 (HCI) • … taken COMP 86 (Object Oriented GUI) • Other courses in graphics, visualization, HCI • Proficiency with GUI frameworks or toolkits • e.g., d3, javascript/HTML5, openGL, MFC, X, Java, Swing, wx, QT, etc.
People • Design Background • Courses in art • Courses in design • Courses in Human Factors • Majors • CS • Human Factors • Engineering • Arts and Science • Undecided • Others? • How do you see yourself? • As a master programmer • As a kickass designer • As a jack of all trades who can solve anything
Discussion • What does “visualization” mean to you?
Representation of Data / Information / Thoughts • René Magritte
This Course • Three Primary Goals! • Design + Programming + Solving Problems • In order to do that: • Gain proficiency with programming with Processing • Learn the mapping of data -> visual form • Understand basic perception theory • Understand basic cognition concepts relating to visual processing • Work with people (stakeholders, teammates) • You should be able to: • Develop usable visualizations to explore data or tell a story! • Work in a team to solve someone’s visualization problem!
Perception and Cognition • Three major concepts: • Pattern Recognition • Color Theory • Perceptual Theory • Gestalt Psychology • Externalization • Symbols • Distributed Cognition • Visual Communication • Storytelling • Design Principles
Pattern Recognition • Why do things “pop out”?
Pattern Recognition • Why do things “pop out”?
Why Visualization Works… • Algorithms question: what is the complexity (in big O notation) of finding a single red dot in n number of blue dots? • What is the complexity (in big O notation) for a human to find a red dot in a sea of blue dots?
Why Visualization Works • Anscombe’s Quartet • R1 - Chapter 1.5, page 7 (p20 in pdf)
Gestalt Psychology • Law of Proximity
Gestalt Psychology • Law of Similarity
Example: Arithmetic Slide courtesy of Pat Hanrahan
Example: Arithmetic Slide courtesy of Pat Hanrahan
Visual Communication • Open Exploration: • http://projects.nytimes.com/census/2010/explorer • “Choose your own adventure” • http://www.nytimes.com/interactive/2012/11/02/us/politics/paths-to-the-white-house.html • Structured, yet flexible narrative • http://www.nytimes.com/interactive/2010/02/02/us/politics/20100201-budget-porcupine-graphic.html
Visual Communication • Compare the two following: • http://www.nytimes.com/interactive/2012/02/13/us/politics/2013-budget-proposal-graphic.html • http://www.nytimes.com/interactive/2010/11/13/weekinreview/deficits-graphic.html
General Information • Course website: • http://www.cs.tufts.edu/comp/150VIZ • Syllabus • Note Colloquium Talks • Textbooks • Homework • Grading • Accommodation
Assignments • Assignment 1: • Install Processing • Implement a simple box that the user can click on • Concepts: • Basic rendering • State maintenance
Assignments • Assignment 2: • Implement: bar chart and line graph • Scale to size of the screen • Concepts: • Data parsing • Data mapping • Basic geometry and layout • Selection (intersection)
Assignments • Assignment 3: • Implement ThemeRiver • http://vis.stanford.edu/protovis/ex/stream.html • Concepts: • Temporal data • Mixed categorical and numeric data • Splines (http://vis.stanford.edu/protovis/ex/splines.html) • Selection of arbitrary shape (intersection)
Assignments • Assignment 4: • Implement SquarifiedTreemap • http://vis.stanford.edu/protovis/ex/treemap.html • Concepts: • Hierarchical Data • Implement existing algorithms • Recursion + geometry
Assignments • Assignment 5: • Implement Node-Link Diagram • http://vis.stanford.edu/protovis/ex/force.html • Concepts: • Relational Data • Force-directed layout • Basic physics engine
Grading • Overall Course: • Assignment 1 13% • Assignment 2 13% • Assignment 3 13% • Assignment 4 13% • Assignment 5 13% • Final Project35% • Total 100% Final Project: Project Success 50% Individual 30% Presentation 10% Self Assessment 10% Total 100%
Extra Credit • Extra Credit 1: • Find a visualization “in the wild” that you like • Explain why • Find a visualization “in the wild” that you do not like. • Fix it • Up to 2% to the final grade • Asked to present in class • Deadline: Wednesday Jan 23, 11:59pm
Example • http://peltiertech.com/WordPress/use-bar-charts-not-pies/