Download
1 / 76
760 likes | 951 Vues
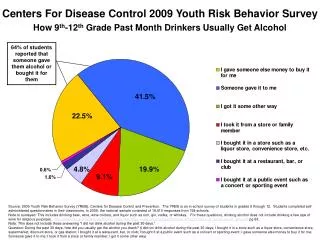
YOUTH RISK BEHAVIOR SURVEY The Bromfield School. Results of the 2018 Emerson Hospital YRBS Prepared for: Emerson Hospital and The Bromfield School, Harvard, Massachusetts. Youth Risk Behavior Survey (YRBS).

E N D
YOUTH RISK BEHAVIOR SURVEYThe Bromfield School Results of the 2018 Emerson Hospital YRBS Prepared for: Emerson Hospital and The Bromfield School, Harvard, Massachusetts
Youth Risk Behavior Survey (YRBS) • Every two years, Emerson Hospital and public school districts within Emerson Hospital’s service area collaborate to conduct the Emerson Youth Risk Behavior Survey (YRBS), a comprehensive survey of youth in 6th grade, 8th grade, and high school, regarding risk behaviors in the following general areas: • Vehicular safety • Social and emotional wellbeing • Physical safety • Sexual behavior • Tobacco, alcohol, and drug use • Diet, body image, and physical activity • Sleep, school work, and screen time • Social media • This report presents findings for The Bromfield School, with breakdowns by grade and student demographics. For more information, please contact: • Bonnie Goldsmith, Senior Director • Public Affairs and Marketing • Emerson Hospital • 978-287-3458 • bgoldsmith@emersonhosp.org Emerson YRBS Background • Emerson YRBS began in 1997 with 4 school districts and students in 6th grade, 8th grade, and 11th grade • The survey has since expanded to include 9 school districts and students in 6th grade, 8th grade, and 9th through 12th grade • More than 11,000 youth participated in the 2018 Emerson YRBS • Questionnaires are age-appropriate and based on YRBS from Centers for Disease Control and Prevention and Massachusetts YRBS • This is the first year Market Street Research has worked directly with Emerson Hospital and the participating school districts on the Emerson YRBS; previous surveys were overseen by James Byrne of Northeast Health Resources 2018 Emerson YRBS – Participating School Districts • Acton-Boxborough Regional School District • Ayer-Shirley Regional School District • Concord-Carlisle High School/Concord Public Schools • Groton-Dunstable Regional School District • The Bromfield School (Harvard Public Schools) • Littleton High School/Littleton Public Schools • Maynard Public Schools • Nashoba Regional School District • Westford Academy/Westford Public Schools
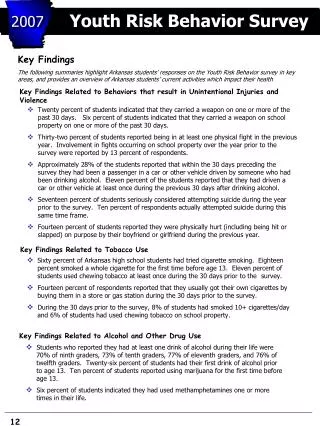
2018 Emerson YRBS MethodologyOverview and Definition of “Aggregate” • Methodology Overview • The Emerson YRBS is a survey of all students in 6th grade, 8th grade, and high school (9th through 12th) • 6th and 8th graders are surveyed using an online platform • High school youth are surveyed using paper questionnaires • To the extent possible, districts survey students in each grade all on the same day, although in 2018 there were adverse weather events and problems with connectivity and survey access that made it challenging to do so. In some districts this did not happen as planned • The surveys are proctored at local schools by teachers and district staff, who are given instructions to read to youth • The online platform, printing of paper questionnaires, and data entry processes were conducted by MJT Inc., the same vendor used in previous Emerson YRBS surveys • In this report, the term “aggregate” refers to the results for all youth surveyed in all districts for 2018. • Census vs. Sample: What is the YRBS? • A census is a survey that includes everyone in the population being surveyed (e.g., all 6th to 12th grade youth) • A sample surveys some members of the population, but not everyone • Emerson YRBS is designed to be as close to a census of 6th grade, 8th grade, and high school youth as possible. • There are, however, some youth who did not participate in the survey, so technically, the YRBS is a sample • Because the sample is so large, however, nearly all differences (including small differences) will test as statistically “significant”, and thus are important to consider • In addition to this report, Emerson Hospital and each of the participating districts has received a set of crosstabulations (by grade and other key variables) that show the results for all questions along with statistics such as medians, averages, etc. The crosstabulations are color-coordinated to show which differences between groups are statistically significant, and which are not. Those that are not statistically significant should be interpreted cautiously
2018 Emerson YRBS Methodology – Details for The Bromfield School • 549 youth were surveyed at The Bromfield School: • 6th graders were surveyed on March 18, 2018 • 8th graders were surveyed on March 18, 2018 • High school youth were surveyed on March 18, 2018 Bromfield School YRBS Response Rate: Total attendance on day of survey: 559 Parent opt-out: 3 (<1%) Responded to survey: 549 (98%) Did not respond to survey: 10 (2%) Youth Participating in 2018 Emerson YRBS The Bromfield School
2018 Emerson YRBS Methodology (cont.) Youth Confidentiality • The Emerson YRBS is conducted in a way that guarantees confidentiality to youth who participate. • Confidentiality is critical for the YRBS, because many of the behaviors discussed in the survey are illegal for minors (or at best, dangerous), and not guaranteeing confidentiality could discourage youth from responding honestly or completely to the survey questions • The surveys are proctored by teachers and district staff, but youth are not required to participate. Youth who prefer not to respond are instructed to either: (1) leave the questions they don’t want to answer blank; or (2) submit a blank questionnaire • For the 2018 Emerson YRBS, 352 youth in total (about 3% of the aggregate) chose not to participate in the survey • Youth names are never collected, thus there is no way to connect individuals to their specific responses • We do collect some demographic information from youth (schools attended, age, grades in school, gender, sexual orientation, and race/ethnicity). As a consequence, there is a remote possibility that districts might be able to identify individuals on this basis. For this reason, any time we report on risk behaviors affecting small numbers, if the group examined includes fewer than 30 youth, we report findings only for the aggregate (all districts combined) • Market Street Research retains the original data in electronic format in an archive for due diligence, but neither Emerson Hospital nor the school districts participating in the 2018 Emerson YRBS will have access to the original data Question Numbers • Question numbers are included throughout this report to assist the reader in cross-referencing with the questionnaire if needed; see example below.
Comparing 2018 YRBS with Previous Years • When Possible, This Report Presents Comparisons with Previous Emerson YRBS • Prior to 2018, the Emerson YRBS was overseen by Jim Byrne of Northeast Health Resources • Market Street Research is only responsible for the quality and completeness of data from the 2018 YRBS • When possible, this report and accompanying materials provided to Emerson Hospital and the participating school districts include comparisons with previous years’ results • Readers should note that Market Street Research cannot provide comparisons in cases in which information from prior years’ surveys: • is not available from the previous vendor, or is missing • is inconsistent with 2018 results due to changes in the questionnaire
AT-A-GLANCE KEY RISK BEHAVIORSAND RECOMMENDATIONS FORFUTURE YRBS
At-A-Glance Selected Risk Behaviors for 2018The Bromfield School
Recommendations for Future Emerson YRBS • There are some questions not asked of 6th graders that Emerson Hospital and the participating school districts may want to include for this age group in the future, because at least 8% or more of 8th graders engage in or experience these behaviors: • Self-injury • Feelings of depression • Using own prescriptions in ways not prescribed (first asked in 2018) • Sexting and viewing pornography • Ask 6th and 8th graders about binge drinking • Violence can occur at school, at home, or in the community. Alcohol/drugs may or may not influence violence in any of these settings. Which is most important in terms of youth experiences at school? There are some questions asked of 6th and 8th graders that cover: (1) behaviors that are rare for these age groups; or (2) behaviors that have declined dramatically in recent years: • Recent cigarette smoking (past 30 days) • Use of chewing tobacco, snuff, pack, or dip • 6th grade use of marijuana (regular and synthetic), although this might change as it is legalized • Selling of illegal drugs on school property by 6th graders • Huffing (lifetime by 6th graders, 30 days by 8th and high school). Consider asking this question the same way for all grades, using one of the versions (not both) • Ever pressured into sex vs. ever had sex didn’t want; consider combining this question or asking one of the versions (not both) Expand Some Questions to 6th Grade Eliminate Some Questions from Earlier Grades Duplicates (Same Issue, Same Groups?) Is this the right issue?
Characteristics of Students Participatingin 2018 Youth Risk Behavior SurveyResults for The Bromfield School • Demographic Profiles: 6th Grade, 8th Grade, and High School • Sleep, Homework, and Screen Time • Participation in Out-Of-School-Time Activities • Breakfast and Caffeine • Regular Physical Exercise
N=78 Bromfield School 6th Grade Youth (Ages range from 10 to 13) N=89 Bromfield School 8th Grade Youth (Ages range from 12 to 15+) Demographic Profile – 6th and 8th Grade The Bromfield School YRBS 1% of Bromfield School 6th graders identify as transgender NOTE: Percentages for race/ethnicity may not add to 100% because youth may identify with more than one category
N=380 Bromfield School High School Youth (Ages range from 13 to 18+) Demographic Profile – High School The Bromfield School YRBS 2% of Bromfield high school youth identify as transgender or “other” in terms of gender 12% of Bromfield high school youth identify as LGBTQ, and 3% are questioning their sexual orientation NOTE: Percentages for race/ethnicity may not add to 100% because youth may identify with more than one category
Grades in SchoolThe Bromfield School YRBS • The 2018 YRBS results clearly indicate that youth’s likelihood of engaging in many risky or unhealthy behaviors goes up as their grades in school go down. This relationship is especially evident for youth whose grades fall in the “C” or below range. Youth whose grades are “D” or below are much more likely than their peers with higher grades to have experienced physical or sexual violence, to have been bullied or bullied others, to have been sexually active, and to have used alcohol, marijuana, or illegal drugs. They also get much less sleep. The link between grades and risk behaviors is discussed in detail throughout this report. Grades in School in Past 12 Months – Bromfield School Youth (2018)
Sleep, Homework and Screen TimeThe Bromfield School YRBS Sleeps an Average of 7 or Fewer Hours Per Night (2002-2018) Bromfield School Trends: Median Hours of Sleep on School Nights (2018) Median Hours of Homework Each Day (2018) = Aggregate (data for Bromfield School not available) NOTE: The sleep question was changed in 2016, adding “each school night.” Median Hours of Screen Time on Average School Days (2018) Medians are mid-points; for example, half of the youth surveyed in 2018 sleep more than 6 hours on school nights, and half sleep less than 6 hours.
Who Gets Most and Least Sleep on School NightsAggregate Comparison Between Groups To protect youth confidentiality, these results are aggregates (all school districts combined). The sample sizes for The Bromfield School YRBS are too small to present separately.
Participation in Out-of-School Time ActivitiesThe Bromfield School YRBS • The majority of Bromfield School youth surveyed in 2018 (88%) are involved in one or more out-of-school-time activities. The median amount of time they spend on these activities is about 2 hours regardless of grade, although the kinds of activities they engage in often change as they age: • 6th graders are most likely to participate in sports (66%), band, orchestra, or choir (23%), or clubs, such as drama, art, debate, etc. (19%) • 8th graders are most likely to participate in sports (72%), clubs (20%), or band, orchestra, or choir (17%) • High school youth are most likely to participate in sports (64%), clubs (44%), volunteer work (39%), or jobs (34%) • Lack of engagement in out-of-school-time activities is associated with higher risks across a spectrum of behaviors. For the aggregate, compared with an overall participation rate of 88% for all youth, those who are significantly likely than their peers to engage in out-of-school-time activities include: • Youth whose grades are in the “C” range (73%) or “D-F” range (61%) • Non-gender-conforming youth (74%) • Youth who admit they have bullied others (73%) or cyber-bullied others (73%) • Youth who have been hurt sexually (73%) or physically (80%) while they or the other persons involved were under the influence of alcohol or drugs • Youth who haven’t come to school on one or more occasions because they don’t feel safe (78%) • African-American youth (79%) 6th Grade (N=77) 8th Grade (N=89) High School (N=377)
Breakfast and CaffeineThe Bromfield School YRBS Ate Breakfast All 7 Days in Past Week (2018) Ate Breakfast Fewer than Five Days in Past Week (2002-2018) Bromfield School Trends = Aggregate (data for Bromfield School not available) Drank a Caffeinated Beverage One or More Times Per Day In Past Week (2010-2018) Bromfield School Trends Drank a Caffeinated Beverage At Least Once in Past Week (2018) = Aggregate (data for Bromfield School not available)
Regular, Vigorous ExerciseThe Bromfield School YRBS • About two-thirds (68%) of the Bromfield School youth surveyed in 2018 reported that they participated in vigorous physical activity 3 or more days during the previous week. • The proportion of youth engaging in regular, vigorous exercise has is currently at an all-time low for Bromfield School youth. Participated in Vigorous Exercise 3 or more Days in Past Week (2018) Participated in Vigorous Exercise 3 or more Days in Past Week (2002-2018) Bromfield School Trends • Vigorous Exercise: • “Physical activity for at least 20 minutes that made you sweat and breathe hard, such as basketball, soccer, running, swimming laps, fast bicycling, fast dancing, or similar aerobic activities.” = Aggregate (data for Bromfield School not available)
Section 1: Helmets and Vehicular Safety • Wearing Helmets • Wearing Seat Belts • Impaired Driving (Alcohol, Marijuana, Cell Phones)
Wearing HelmetsThe Bromfield School YRBS • The majority—but not all—Bromfield School youth surveyed in 2018 said that they “always” wear helmets when riding a bicycle or when skiing or snowboarding. Fewer than half wear helmets when rollerblading or skateboarding. In general, use of helmets declines as youth age. • Groups most likely to say they • “never wear helmets” (aggregate results): • Has been hurt sexually (46%) or physically (43%) • Grades at “C” or below (35%) • Has bullied others (34%) or cyber-bullied (34%) • Non-gender-conforming youth (33%) • African-American youth (33%) • Hispanic/Latino youth (24%) • Misses school because doesn’t feel safe (23%) • Smokes, chews, vapes (24%-44%) • Uses illegal drugs (25%-64%) Proportion of Youth Who Always Wear Helmets (2018)
Wearing Seat BeltsThe Bromfield School YRBS Proportion of Youth Who Rarely or Never Wear Seat Belts • Most Bromfield School youth wear seat belts while they are passengers in cars. The proportion who rarely or never do so has declined steadily since 2002 when questions about seat belts were first asked of youth in the region. High school youth are slightly less likely than their younger peers to wear seat belts as passengers, but the difference is not large. • High school youth are not always as careful about wearing seatbelts when they are driving. In fact, about 18% of Bromfield School 12th graders, and 5% of 11th graders, admitted that do not “always” wear seat belts when they are driving. Note that the lower proportions for 9th and 10th graders are probably due to the fact that many of these youth do not yet drive. This question is new for 2018 so comparisons across time are not available. How Often 6th and 8th Graders Wear Seat Belts as Passengers (2018) = Aggregate (data for Bromfield School not available) High School Youth and Seat Belts (2018)
Impaired Driving (Alcohol, Marijuana, Cell Phones)The Bromfield School YRBS • There are a variety of ways in which youth might be exposed to impaired driving. The most common experience of impaired driving is among high school students riding in vehicles while drivers are using cell phones (45% for Bromfield School), followed by older teens driving and using cell phones (e.g., 36% of Bromfield School 12th graders have done this in the past 30 days). Many older teens also use marijuana when they drive (e.g., 24% of Bromfield School 12th graders). Proportion of Youth Experiencing Impaired Driving (2018) Not asked of 6th and 8th graders Not asked of 6th and 8th graders Not asked of 6th and 8th graders Not asked of 6th and 8th graders
Impaired Driving (cont.)The Bromfield School YRBS • The most frequent response when Bromfield School youth are passengers in vehicles whose drivers are using cell phones unsafely is to do nothing (35%). Only a very small proportion of youth say they insist on being let out when drivers refuse to stop using cell phones (1%). Many times, youth say they ask drivers to stop using cell phones and the drivers don’t stop (10%). Only 34% said that asking drivers to stop using cell phones results in cessation of the behavior. Proportion of Youth in Vehicles With Drivers Under Age 18 Who Have Been Drinking Alcohol or Using Drugs (2002-2018 YRBS) Bromfield School Trends How Assertive Youth Have Been As Passengers In Vehicles Whose Drivers are Using Cell Phones (2018) = Aggregate (data for Bromfield School not available)
Section 2: Emotional Wellbeing • Trusted Adults in School • Major Sources of Stress • Depression and Suicidal Ideation • Body Image and Weight
Trusted Adults in SchoolThe Bromfield School YRBS • More than three-fourths (79%) of the Bromfield School youth surveyed in 2018 said there is at least one teacher or other adult in their school who they could talk to if they had a problem. This proportion is relatively consistent across grades until high school, when the proportion of youth who have adults they can talk to at school increases for some grades, reaching 90% by 12th grade. • Not having a trusted adult at school is significantly associated with a number of other risks. Across all of the school districts (aggregate), the following youth are much less likely than their peers to have trusted adults at school: • Youth who have been hurt physically or sexually while they or the perpetrator(s) were under the influence of alcohol or drugs (45% and 44%, respectively) • Youth who have been bullied (62%), cyber-bullied (61%), or who have bullied others (50%) • Youth who have social media accounts their parents aren’t aware of (64%) • Youth who have used any of the following drugs: marijuana (71%), cocaine (55%), heroin (43%); meth (44%), MMDA (52%) Percent of Youth Surveyed in 2018 With Trusted Adults at School
Major Sources of StressThe Bromfield School YRBS • By far the greatest source of stress reported by youth in 2018 is school; this is true for all grades, although the proportion experiencing high stress as a consequence of school increases substantially with age. Percent of Youth Experiencing “Somewhat High” to “Very High” Stress (2018) Percent of Youth Experiencing “Somewhat” to “Very High” Stress Due to Academics, by Grade (2012-2018), Aggregate Trends (District Data Not Comparable) AGGREGATE FINDING: 67% of youth say school is the greatest source of stress in their lives
Major Sources of Stress (cont.)The Bromfield School YRBS • The top three strategies Bromfield School youth use most often to deal with stress are: • Exercise (47%) • Watching television (47%) • Eating (41%) • Many Bromfield School youth also rely on meditation or relaxation activities (21%). Some result to negative behaviors, such as drinking, drugs, or smoking (12%), vaping (11%), or self-injury (6%). • Drinking, drugs, smoking, and vaping become more common as youth age, and are most likely to be used as strategies by 12th graders. Self-injury, on the other hand, is used by youth to relieve stress about as often in 6th grade as in high school. Strategies Used Most Often to Deal with Stress (2018)
Many Bromfield School youth surveyed in 2018 have struggled with sad feelings and/or have contemplated suicide. In 2018, 20% of 8th graders and 21% of high school youth reported that they had felt so sad or hopeless almost every day for 2 weeks ore more in a row, that they stopped doing some of their usual activities. About 15% of Bromfield School youth seriously considered suicide this past year; 9% made a plan for suicide; and 3% attempted suicide at least once during the ear. Sixteen Bromfield School youth surveyed in 2018 (about 3% of the total for the district) said they attempted suicide and 6 said the result was an injury, poisoning, or overdoes that had to be medically treated. Depression and SuicideThe Bromfield School YRBS Depression, Suicidal Ideation, and Attempted Suicide (2018) Not asked of 6th graders Not asked of 6th graders
The proportions of high school youth who have seriously considered suicide and/or actually attempted suicide have declined gradually since these questions were first asked in 2002. For 6th and 8th graders, however, levels of suicidal ideation and attempted suicide have fluctuated, and at the Bromfield School, are now at the highest point in recent years. In all grades, youth at greatest risk of suicidal ideation and attempted suicide have the same characteristics as youth at risk of other risks; namely, those who have been bullied, those who have bullied others; those who have experienced physical or sexual violence or have been sexually harassed, those who lack trusted adults they can talk to or who feel unsafe coming to school, and those who use tobacco, alcohol, and drugs. Depression and Suicide (cont.)The Bromfield School YRBS Suicidal Ideation and Attempted Suicide (2002-2018 YRBS) Bromfield School Trends Level has recently declined for Bromfield School high school youth … In this chart, = aggregate (data for Bromfield School not available) … but has increased for Bromfield School 6th and 8th graders
In 2018, youth were asked whether anyone at school told them in the past 12 months that they were thinking about hurting themselves or attempting suicide, and what they did with this information. About a third (31%) of Bromfield School youth surveyed this year are worried about their peers in this respect. In aggregate, concern about peers is highest among: 8th graders and high school youth (33% and 35% respectively) Females (40%) and non-gender-conforming youth (51%) LGBTQ youth (36%) Youth who use tobacco (22%-46%) Youth who use drugs (38%-52%) Youth who have missed school because they don’t feel safe (57%) Youth who are themselves depressed (54%) or have considered or attempted suicide (54%-61%) Depression and Suicide (cont.)The Bromfield School YRBS Is Worried About Peers Harming Themselves or Attempting Suicide (2018) More often than not, youth who worry about their peers harming themselves or attempting suicide are not communicating about it with adults who could help.
About 17% of the Bromfield School youth surveyed in 2018 have hurt or injured themselves on purpose, such as by cutting, burning, or bruising themselves. The rate peaks around 9th and 11th grades (22% and 19%, respectively). In aggregate, youth likely to engage in self-injury have the same profile as youth who are depressed and/or suicidal; namely, the rate of self-injury is highest among females, non-gender-conforming youth, LGBTQ youth, youth who have missed school because they don’t feel safe, youth who have been hurt physically or sexually, and youth who use tobacco, alcohol, or drugs. Self-InjuryThe Bromfield School YRBS Hurt or Injured Self on Purpose, Past Year (2018) Number of Times Has Hurt or Injured Self On Purpose, Past Year (2018) Hurt or Injured Self on Purpose (2004-2018 YRBS) Bromfield School Trends = Aggregate (data for Bromfield School not available)
Bromfield School youth surveyed in 2018 have a variety of different opinions about how much they weigh, and vary in terms of what they are doing about their weight. About one-fourth (24%) think they are overweight, and 38% are trying to lose weight. About 19% think they are underweight, and a similar proportion are trying to gain (16%). For the aggregate, the following groups are more likely than their peers to think they are overweight: Non-gender-conforming youth (41%) Youth whose grades are in the “D-F” range (35%) Hispanic youth (31%) Youth who have missed school because they don’t feel safe (34%) Depressed (33%), suicidal (39%), or has attempted suicide (40%) Has been hurt sexually (39%) Has been bullied (32%) or has bullied others (32%) Has been cyber-bullied (31%) or has cyber-bullied others (31%) Has been sexually harassed (35%) Body Image and WeightThe Bromfield School YRBS Is Trying to Lose Weight (2002-2018 YRBS) The Bromfield School Trends = Aggregate (data for Bromfield School not available)
The two most frequently-used strategies for either losing weight or not gaining weight are, for Bromfield School youth surveyed in 2018, exercising (34%), and combining exercise with less food, fewer calories, low-fat foods, etc. (19%). About 6% have tried fasting, 8% have gone on “cleansing diets” without a doctor’s advice, and small proportions make themselves vomit or take laxatives (3%) or have taken diet pills, powders, or liquids (3%). The rate of fasting among Bromfield School youth increased significantly this year for all grades, compared with the 2016 YRBS. Body Image and Weight (cont.)The Bromfield School YRBS Fasted (2002-2018 YRBS) Bromfield School Trends Strategies for Losing Weight or Not Gaining Weight (2018) Not asked of 6thgraders
Section 3: Risk Behaviors and the Internet • Unmonitored Use of Social Media • Risky Sharing of Information Electronically • Sexting (Sharing Explicit Material Electronically • Viewing Pornography • Online Fantasy Sports Gambling
Unmonitored Use of Social MediaThe Bromfield School YRBS • Has Social Media Account(s) • Parents/Guardians Don’t Know About (2018) • About one-fourth (25%) of Bromfield School youth surveyed in 2018 have social media accounts their parents or guardians don’t know about. More than one-half (58%) said their parents or guardians do not monitor their social media use at all. • Bromfield School parents and guardians who do monitor youth use of social media typically do so by: • Following accounts weekly or more often (14%) • Requiring a contract and ground rules for phones, tablets, or computers (11%) • Requiring that youth use phones, tablets, or computers only at certain times (8%) • Using parental controls on phones, tablets, or computers (6%) • Using monitoring, blocking, or filtering software (6%) • Requiring that youth use phones, tablets, or computers only in certain places in the home (4%) • Percent of Youth Whose Parents • Don’t Monitor their Social Media Use (2018)
Risky Sharing of Information ElectronicallyThe Bromfield School YRBS • About one-fourth (28%) of the Bromfield School youth surveyed in 2018 have, at some point, found themselves in unwanted or risky situations because of information they shared electronically. This percentage is highest for high school youth (26%-35% depending on grade). • For the aggregate, groups most likely to have found themselves in unwanted or risky situations because they shared information electronically include: • Youth who have been hurt physically (61%) or sexually 62%) while they or the perpetrators were under the influence of alcohol or drugs • Youth who have been bullied (43%), have bullied others (43%), have experienced cyber-bullying (60%), or have cyber-bullied others (64%) • Youth who have missed school because they don’t feel safe (48%) • Youth who have social media accounts their parents don’t know about (40%) • Non-gender conforming youth (40%) • Youth whose grades average “C” or below (34%) • Has Ever Found Self in Risky or Unwanted Situation • Because of Information Shared Electronically (2018)
Sexting (Sharing Explicit Material Electronically)The Bromfield School YRBS • “Sexting” involves electronic sending or receiving of sexually explicit messages or photos via social media (such as SnapChat, Instagram, etc.) About one-fourth (24%) of Bromfield School youth surveyed in 2018 admitted to sexting, with the likelihood of having done so increasing with age. The rate of sexting for high school youth has increased at the Bromfield School every YRBS year since 2014. • For the aggregate in 2018, groups most likely to have sexted in the past 12 months include: • Youth who have been hurt physically (69%) or sexually (72%) while they or the perpetrators were under the influence of alcohol or drugs • Youth who have experienced cyber-bullying (45%), have bullied others (51%), or cyber-bullied others (59%) • Youth whose grades are in the “D-F” range (47%) • Youth who have been sexually harassed at school (48%) • Youth who have missed school in the past year because they don’t feel safe (40%) • Youth who have felt depressed (35%), have planned suicide (40%), or have attempted suicide (43%) • Has Sent or Received Sexually Explicit Messages • Or Photos Electronically in Past Year (2018) • Has Sent or Received Sexually Explicit Messages • Or Photos Electronically in Past Year (2010-2018 YRBS) • Bromfield School Trends = Aggregate (data for Bromfield School not available)
PornographyThe Bromfield School YRBS • Has Looked at Pornographic Material in Past 30 Days • (Electronic or Any Other Format, 2018 Results) • About two-fifths (41%) of Bromfield School youth surveyed in 2018 said they have looked at pornographic material, either in electronic or any other format, in the past 30 days. Viewing pornography increases with age, with 12th graders admitting the highest rate (57%). • The following groups are most likely to have viewed pornographic material in the past 30 days (aggregate findings): • Youth who have been hurt physically (77%) or sexually (72%) while they or the perpetrators were under the influence of alcohol or drugs • Youth who have bullied others (72%) or cyber-bullied others (70%) • Males (56%) • Youth who have social media accounts their parents don’t know about (52%) • Youth who have planned suicide (46%) or attempted suicide (51%) • Youth whose grades average “C” or below (48%) • High School Youth: Has Looked • at Pornographic Material (2016 and 2018 YRBS) • Aggregate Trends (Not Available for District) For the aggregate, youth who do view pornographic material have done so a median of 11 out of the past 30 days. This is fairly consistent regardless of grade—the median for 8th graders is 9 out of the past 30 days, vs. a high of 12 days for 11th graders.
Participation in Online Fantasy Sports GamblingThe Bromfield School YRBS • Has Participated in Online Fantasy Sports Games or Websites Where Money is Wagered, Past Year (2018) • A fantasy sport (also known as rotisserie or roto) is a type of online game where participants assemble imaginary or virtual teams of real players of a professional sport, such as football or basketball. These teams compete based on the statistical performance of the players in the actual games. Many of these games allow wagering. Nationally, about 14% of the U.S. population participates regularly in some sort of fantasy league.* • In the past year, 8% of Bromfield School youth surveyed have participated in an online fantasy sports game (or visited a website) where money is wagered. This is lower than the aggregate rate (8% vs. 12% for all school districts combined) • Participating in online fantasy sports varies with age: about 3% of Bromfield School 6th graders have done so, and the rate is highest in 10th grade (13%) • For the aggregate, the following groups are most likely to have participated in online fantasy sports in the past year: • Uses tobacco (25%-57%) • Uses illegal drugs (36%-64%) • Has been hurt physically (43%) or sexually (46%) • Has bullied (30%) or cyber-bullied others (40%) • Males (21%) and non-gender-conforming (27%) • Grades average “D-F” (28%) • Has social media account(s) that parents don’t know about (17%) * Kounang, Nadia. “The Time-Sucking, Dopamine-Boosting Science of Fantasy Baseball.” CNN, March 18, 2016 (www.cnn.com).
Section 4: Bullying • Bullying • Cyber-Bullying • Sexual Harassment
BullyingThe Bromfield School YRBS • Has Been Bullied (2018) • “Bullying” is defined as repeatedly threatening, humiliating, or acting in a hostile manner towards another person. About 8% of Bromfield School youth surveyed in 2018 said they had been bullied during the year, and 2% said they had bullied others. • The most common responses to bullying reported by Bromfield School youth include telling the person to stop (5%), walking away (5%), telling adults at home (4%) or at school (3%), and doing nothing (4%). • Has Bullied Others (2018) • Has Been Bullied (2012-2018 YRBS), • Bromfield School Trends = Aggregate (data for Bromfield School not available)
Who is Most Likely to Be Bullied/Bully OthersAggregate Comparisons Between Groups
Cyber-BullyingThe Bromfield School YRBS • Has Been Cyber-Bullied (2018) • “Cyber-bullying” involves repeatedly threatening, humiliating, or expressing hostility to another person using the internet (electronically). About 7% of Bromfield School youth surveyed in 2018 said they, personally, had been cyber-bullied, and about 3% said they had cyber-bullied others. • Many youth who are cyber-bullied do nothing about it, but some do react. The most frequently mentioned responses among Bromfield School youth are: • Telling a friend or peer at school (5%) • Telling a parent or guardian (4%) • Telling an adult at school (1%) • Reporting to website administrator (1%) • Reporting it to the police (1%) • Not doing anything about it (6%) • Has Cyber-Bullied Others (2018) • Has Been Cyber-Bullied (2012-2018 YRBS), • Bromfield School Trends = Aggregate (data for Bromfield School not available)
Who is Most Likely to Be Cyber-Bullied/Cyber-Bully Others – Aggregate Findings
Bullying vs. Cyber-Bullying – Aggregate Findings • Youth who bully others are highly likely to have, themselves, been bullied either physically or electronically: • 64% of youth who have bullied others have been bullied • 61% of youth who have cyber-bullied others have been cyber-bullied • Physical bullying and cyber-bullying are often linked (e.g. 41% of those bullied have also been cyber-bullied) • Youth who experience bullying or cyber-bullying often go on to perpetuate these experiences on others: • 17% of youth who have been bullied, have also bullied others • 21% of youth who have been cyber-bullied, have also cyber-bullied others
Sexual HarassmentThe Bromfield School YRBS • For the 2018 YRBS, “sexual harassment” was defined as unwelcome comments or actions of a sexual nature which made youth uncomfortable. About 14% of Bromfield School youth surveyed in 2018 said they had experienced sexual harassment in school during the past year. • Most often, sexual harassment reported by Bromfield School youth consists of: • Verbal harassment (9%) • Sexually explicit messages or photos sent electronically (7%) • Unwanted physical contact (5%) • Gestures (4%) • The most frequent responses to sexual harassment reported by Bromfield School youth are to do nothing about it (9%) or to tell the person to stop (7%). • Sexual harassment affects some groups much more than others—these differences are discussed next. Percent of Youth Who Have Experienced Sexually Harassment (2018) Percent of Youth Who Have Experienced Sexually Harassment (2016-2018 YRBS), Aggregate Trends (Not Available for District)
Sexual Harassment (cont.)Aggregate Comparison Between Groups • Youth experience sexual harassment in different ways. Females, for example, are about 4 times as likely as males to report having experienced sexual harassment in the past 12 months, and the types of sexual harassment they report—and their responses to it—also differ from males’ experiences. Gender is not the only factor associated with the experience of sexual harassment—in fact, the following groups aremost likely to report having been sexually harassed in the past year: • Has been hurt physically (42%) or sexually (64%) • Has been bullied (34%) or has bullied others (41%) • Has been cyber-bullied (37%) or has cyber-bullied others (37%) • Youth whose grades are in the “D-F” range (24%) • Youth who use tobacco (18%-28%) • Youth who use illegal drugs (35%-48%) • Youth who have missed school because they don’t feel safe (36%) • Depressed (24%), suicidal ideation (28%), or attempted suicide (29%) • Is worried about a suicidal peer (20%) • Has social media accounts parents/guardians don’t know about (17%)
Section 5: Violence • Feeling Safe at School • Bringing Weapons to School • Influence of Alcohol and/or Drugs on Violence • Dating Violence • Unwanted Sexual Contact (Pressure to Have Sex)
Feeling Safe at SchoolThe Bromfield School YRBS • Most Bromfield School youth surveyed in 2018 haven’t missed any school in the past month because they felt they would be unsafe at school or on their way to or from school. About 5% of the district’s youth have missed school for these reasons, however. This proportion is higher than average for 8th graders (13%). • Not feeling safe at school is associated with a number of risk behaviors, including having been bullied, bullying others, having been hurt physically or sexually, and use of alcohol or drugs. These associations are discussed throughout this report. • A small proportion (2%) of Bromfield School high school youth surveyed in 2018 said they had been threatened or injured on school property by someone with a weapon, such as a gun, knife, or club. Has Missed School in Past 30 Days Because Doesn’t Feel Safe (2018) Has Been Threatened or Injured At School in Past Year by Someone With a Weapon – High School (2018)