Download
1 / 18
180 likes | 498 Vues
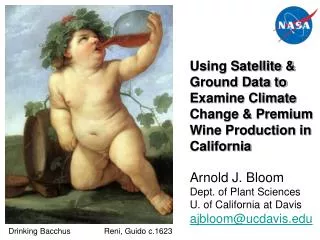
Arnold J. Bloom Dept. of Plant Sciences U. of California at Davis ajbloom@ucdavis.edu. Using Satellite & Ground Data to Examine Climate Change & Premium Wine Production in California . Drinking Bacchus Reni, Guido c.1623. 1947 Chateau Cheval Blanc Vinfolio San Francisco, July 2006

E N D
Arnold J. BloomDept. of Plant SciencesU. of California at Davisajbloom@ucdavis.edu Using Satellite & Ground Data to Examine Climate Change & Premium Wine Production in California Drinking Bacchus Reni, Guido c.1623
1947 Chateau Cheval Blanc VinfolioSan Francisco, July 2006 $33,781.25 2005 Charles Shaw Merlot“Two-buck Chuck”Trader Joe’s $1.99
“Premium wine grapes are produced almost exclusively in a narrow climatic range characterized by a lack of both extreme heat and extreme cold.” Napa Valley Petit Verdot grapes = $5,409 per ton San Joaquin Valley red grapes = $270 per ton 20-fold difference in price
Anticipated changes in global average temperatures under different emission scenarios according various computer models Stott et al. 2006, IPCC 2007
Current and anticipated percentages of suitable years for premium wine-grape production in various locations in the United States according to computer models M. A. White et al. (2006) PNAS 103:11217-11222
Observed changes in global average temperatures with respect to the average from 1951 to 1980 Hansen et al. 2006 PNAS103:14288-14293
Ft. Bragg Colfax Davis Napa
WinklerScale • Technique for classifying the climate of wine growing regions. • Developed at UC Davis by A. J. Winkler and M. Amerine 1944. • Sum of degree days over 10°C from April 1 until October 31. = Σmax [(avg. daily temp. – 10), 0]
WinklerScale • Regions I (1,111 – 1,390 growing-degree days) and II (1,391 – 1,670 growing-degree days) generally produce the best dry table wines with light to medium body and good balance. • Region III (1,671 – 1,950 growing-degree days) produces full-bodied dry and sweet wines. • Region IV (1,951 – 2,220 growing-degree days) is best for fortified wines, with table wines being inferior. • Region V (2,220 – 2,499 growing-degree days) is best for table grapes and makes low-quality table wines.
Ft. Bragg0 ColfaxIII DavisV NapaIII
WinklerScale • Regions I (1,111 – 1,390 growing-degree days) and II (1,391 – 1,670 growing-degree days) generally produce the best dry table wines with light to medium body and good balance. • Region III (1,671 – 1,950 growing-degree days) produces full-bodied dry and sweet wines. • Region IV (1,951 – 2,220 growing-degree days) is best for fortified wines, with table wines being inferior. • Region V (2,220 – 2,499 growing-degree days) is best for table grapes and makes low-quality table wines.
Conclusions • Satellite data • Spatial resolution too low • Time scale too short • White et al. (2008) http://digitalcommons.unl.edu/cgi/viewcontent.cgi?article=1025&context=nasapub • Ground data • Year-to-year variation obscures trends • Running averages show trends • Climate change is shifting premium grape growing areas