Download
1 / 64
640 likes | 985 Vues
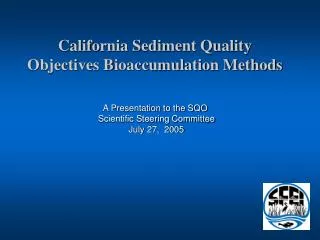
California Sediment Quality Objectives Bioaccumulation Methods. A Presentation to the SQO Scientific Steering Committee July 27, 2005. Presentation Summary. Background and Conceptual Model Three Lines of Evidence Technical Issues With Each Line of Evidence. Conceptual Model.

E N D
California Sediment Quality Objectives Bioaccumulation Methods A Presentation to the SQO Scientific Steering Committee July 27, 2005
Presentation Summary • Background and Conceptual Model • Three Lines of Evidence • Technical Issues With Each Line of Evidence
Conceptual Model Exposure Assessment Effects Thresholds For Humans Effects Thresholds For Wildlife/Fish Chemical uptake via diet, respiration Effects Assessment
Multiple Lines of Evidence Approach Exposure Assessment Effects Thresholds For Humans Effects Thresholds For Wildlife/Fish Chemical uptake via diet, respiration Effects Assessment
Indirect Effects Multiple Lines of Evidence (MLOE) Human Lines of Evidence Fish and Wildlife Lines of Evidence Fish Concentration Fish Concentration Laboratory Bioaccumulation Concentration Laboratory Bioaccumulation Concentration Sediment Concentration Sediment Concentration
1. Fish Line of Evidence • Tissue contaminant concentration in field captured fish • Assesses beneficial use impairment. • Does not directly implicate sediments: • Other sources (water column, watershed loading) • Fish movement Fish Concentration Laboratory Bioaccumulation Concentration Sediment Concentration
2. Sediment Line of Evidence • Contaminant concentrations in sediments • Assess whether sediments are a potential source. • Does not assess variations in bioavailability • Physical parameters, e.g., soot carbon, paint chips. Fish Concentration Laboratory Bioaccumulation Concentration Sediment Concentration
3. Bioaccumulation Line of Evidence • Contaminant concentrations in laboratory bioaccumulation tests • Are sediment contaminants bioavailable? • Has limitations • Difficulty achieving equilibrium • Laboratory extrapolation Fish Concentration Laboratory Bioaccumulation Concentration Sediment Concentration
Technical Issues • Fish Line of Evidence • What are appropriate target species? • What assumptions to use in calculating tissue thresholds? • Consumption rate • Risk level • Bioaccumulation Line of Evidence • What are the most appropriate tests? • What are appropriate thresholds? • Sediment Chemistry Line of Evidence • How address fish movement? • How translate from fish threshold to sediment threshold?
Technical Issues • Fish Line of Evidence • What are appropriate target species? • What assumptions to use in calculating tissue thresholds? • Consumption rate • Risk level • Bioaccumulation Line of Evidence • What are the most appropriate tests? • What are appropriate thresholds? • Sediment Chemistry Line of Evidence • How address fish movement? • How translate from fish threshold to sediment threshold?
Target Species Species previously monitored in CA Bays and Estuaries with sediment linkage in adult lifestyle: Arrow Goby Black Surfperch California Corbina California Halibut California Killifish Dwarf Surfperch English Sole Leopard Shark Longfin Sanddab Pacific Sanddab Pacific Staghorn Sculpin Saddleback Sculpin Shiner Surfperch Slender Sole Speckled Sanddab Spotted Sandbass Starry Flounder Striped Mullet Walleye Surfperch White Croaker White Surfperch Yellowfin Goby
Target Species Prey For Humans and Wildlife Limited Variation in Diet or Home Range Sediment Linkage
Target Species - Sediment Linkage Bold indicates significant r^2 value and positive slope
Target Species - Sediment Linkage • Evaluate different species using mechanistic model simulations • Gobas model parameterized for San Francisco Bay • Includes dietary and respiratory uptake • Run simulations setting water vs. sediment input to zero to estimate relative influence of waterborne vs. sediment contaminants • Approach may be used locally wherever food web data are available
Technical Issues • Fish Line of Evidence • What are appropriate target species? • What assumptions to use in calculating tissue thresholds? • Consumption rate • Risk level • Bioaccumulation Line of Evidence • What are the most appropriate tests? • What are appropriate thresholds? • Sediment Chemistry Line of Evidence • How address fish movement? • How translate from fish threshold to sediment threshold?
Fish Tissue Thresholds For Protecting Humans • Standard risk assessment approach • Threshold Fish Concentration = Function of (Toxicity Reference Value, Dose, Body Size) • Threshold choice is in large part a policy decision • Target population to protect (e.g., consumption rate) • Allowable Risk Level
Fish Tissue Thresholds For Protecting Humans • Comparison of thresholds using different assumptions: • Federal or state recommended policies • Two additional thresholds represented more or less • conservative assumptions
Fish Tissue Thresholds For Protecting Humans Thresholds vary greatly depending on assumptions
Exceedances Using Different Thresholds Effects thresholds vs. organic contaminant concentrations in three sportfish species (Shiner Surfperch, California Halibut, and White Croaker) • Human thresholds generally lower - will drive the SQO • DDT is an exception • Chlordane generally does not exceed thresholds
Appropriate Assumptions for Thresholds Bioaccumulation Work Group Also Many BTAG Members
Fish Tissue Thresholds For Protecting Wildlife • General approach: • Threshold Fish Concentration = Function of (Toxicity Reference Value, Dose, Body Size) • Dose based on body mass allometry equation • Statewide based on generic species classes • Local regulators refine with site-specific data for individual water bodies
Fish Tissue Thresholds For Protecting Wildlife • Toxicity Reference Values: • DDTs, PCBs, Hg - Using USEPA Region 9 BTAG TRV-Low • Dieldrin - USEPA ECO-SSL values • Chlordane - no consensus values available • Mammals - Khasawinah and Grutsch 1989 • Birds - Stickel et al. 1983 • Recall that chlordanes do not exceed thresholds for any fish (N = 192)
Fish Tissue Thresholds For Protecting Wildlife • Avian results lower • Small animals lower
Exceedances Using Different Thresholds Comparison of organic contaminant concentrations in three sportfish species (Shiner Surfperch, California Halibut, and White Croaker) to wildlife and human effect thresholds • Among wildlife, small birds would drive the SQO for • PCBs and DDTs
Technical Issues • Fish Line of Evidence • What are appropriate target species? • What assumptions to use in calculating tissue thresholds? • Consumption rate • Risk level • Bioaccumulation Line of Evidence • What are the most appropriate tests? • What are appropriate thresholds? • Sediment Chemistry Line of Evidence • How address fish movement? • How translate from fish threshold to sediment threshold?
Methods Guidance:Target Species - Lab Test Organisms • Species with existing data in SQO database • Macoma nasuta is a good species for Laboratory • Bioaccumulation test • -Recommended for bed sediment testing (EPA guidance) • -Deposit feeder with high contaminant tolerance • -Large California database available
Target Species - Macoma nasuta Summary of regression analysis of summed contaminant concentrations in sediment and Macoma nasuta tissue. * = significant linear relationship (p<0.05) ND = No Data Available
Macoma nasuta - Total HPAHs 6 R2 = 0.7042 (SD) R2 = 0.3771 (SP) 5.5 R2 = 0.1982 (SF) R2 = 0.0027 (TOM) 5 4.5 4 3.5 3 2.5 2 1.5 1.5 San Diego San Pedro SF Tomales Linear (SF) Bivalve Tissue Concentration (log x+1, ug/kg, dry wt.) Linear (San Diego) Linear (Tomales) Linear (San Pedro) 2 2.5 3 3.5 4 4.5 5 5.5 6 Sediment Concentration (log x+1, ug/kg, dry wt.) Macoma nasuta tissue data indicate different results for different water bodies. BSAFs vary among waterbodies
Technical Issues • Fish Line of Evidence • What are appropriate target species? • What assumptions to use in calculating tissue thresholds? • Consumption rate • Risk level • Bioaccumulation Line of Evidence • What are the most appropriate tests? • What are appropriate thresholds? • Sediment Chemistry Line of Evidence • How address fish movement? • How translate from fish threshold to sediment threshold?
Bioaccumulation Line of Evidence:Methods of Evaluation B • How establish threshold with this line of evidence? Potential methods: • Test for any bioavailability • Organism tissue concentrations above concentrations in control organisms • Test for bioaccumulation • BSAF > 1 • Test for tissue effects threshold exceedance • Use test organisms as surrogates for dietary exposure to fish, wildlife, and humans • With 28-day test, must correct for lack of equilibrium in short time frame
Bioaccumulation Line of Evidence:Methods of Evaluation B 3. Test for tissue effects threshold exceedance • Correcting for lack of equilibrium in 28 day time frame • More conservative approach: multiply laboratory results by 4 (USEPA Ocean Disposal Testing Manual 1991) • Less conservative approach: multiply laboratory results by factor between 1 and 3, depending on compound Kow (USEPA Inland Testing Manual 1998; McFarland 1994) • Use longer time frame e.g., 45 day test (very costly)
Technical Issues S • Fish Line of Evidence • What are appropriate target species? • What assumptions to use in calculating tissue thresholds? • Consumption rate • Risk level • Bioaccumulation Line of Evidence • What are the most appropriate tests? • What are appropriate thresholds? • Sediment Chemistry Line of Evidence • How address fish movement? • How translate from fish threshold to sediment threshold?
Fish Movement S • Fish have variable home ranges and are often not captured where sediment data available. • Approach: • Fish concentrations compared with sediments in a disk centered at each fish sampling location. • Disk size ranged from 0.5 - 15 km (0.5 km increments) • No a priori assumptions about fish home range
Identify best spatial scale to combine fish and sediment data.
Diagnose spatial association between fish and sediment contamination for a given water body.
Technical Issues • Fish Line of Evidence • What are appropriate target species? • What assumptions to use in calculating tissue thresholds? • Consumption rate • Risk level • Bioaccumulation Line of Evidence • What are the most appropriate tests? • What are appropriate thresholds? • Sediment Chemistry Line of Evidence • How address fish movement? • How translate from fish threshold to sediment threshold?
Translating From Fish Threshold To Sediment Threshold S Effects Thresholds For Humans Effects Thresholds For Wildlife/Fish ?
Translating From Fish Threshold To Sediment Threshold S • Potential Approaches: • BAF and BSAF • Regression Model • Mechanistic Model • Combine 1 and 3
Focus of Effort Non-ionic organic compounds with extensive exposure and effects data PCBs Legacy Pesticides (DDTs, Chlordanes, Dieldrin)
1. BAF and BSAF • 1. BSAF = Lipid-normalized tissue conc./ organic carbon-normalized sediment conc. • 2. BAF = Tissue conc. / sediment conc. • Both methods use paired samples from multiple locations, pooling data from a representative range when necessary
BAF vs. BSAF 100 2 R = 0.2541 10 BAF Tissue DDT (ug/kg) 2 R = 0.6585 BSAF 1 1 10 100 1000 0.1 Sediment DDT (ug/kg) DDTs in San Francisco Bay Macoma clams vs. sediment
BAF Example Application • Using the shiner surfperch dataset from San Francisco Bay, calculated the BAF for each sample (N = 43) • Determined distribution to be log- normal • Determined geometric mean BAF and used it to backcalculate sediment thresholds from tissue thresholds • Less conservative • Determined 95% CI to estimate high-end BAF and backcalculate low end sediment thresholds • More conservative
BAF Example Application • Example results in three thresholds • More conservative threshold - 95%ile BAF using • CTR tissue criteria • Intermediate threshold - GeoMean BAF using CTR • Less conservative threshold - GeoMean using • US EPA Screening Value for general population
40 30 High toxicity Threshold 4 Biota Concentration 20 Low toxicity Threshold 2 10 0 0 2 4 6 8 10 Sediment Concentration 2. Regression Modeling
Total Chlordanes - Shiner Surfperch - San Francisco Bay 2.5 2 1.5 2 R = 0.2627 Fish Tissue Chlordanes (logx+1) ug/kg (dry wt.) 1 0.5 0 0 0.5 1 1.5 Sediment Chlordanes (logx+1) ug/kg (dry wt.) F
2. Regression modeling • Cannot predict well outside data range • High data requirements • High uncertainty
Translating From Fish Threshold To Sediment Threshold3. Mechanistic Modeling • Uptake • Dietary • Gill • Loss • Excretion • Egestion • Gill Elimination • Metabolism Growth Chemical properties (e.g., Kow) important