PAVEMENT CONDITION SURVEYS
Lecture 4. PAVEMENT CONDITION SURVEYS. Instructional Objectives. Need for condition surveys Collection methodologies Four basic types of condition surveys Different procedures and equipment available. Need for Condition Surveys. Evaluate current condition of pavement

PAVEMENT CONDITION SURVEYS
E N D
Presentation Transcript
Lecture 4 PAVEMENT CONDITION SURVEYS
Instructional Objectives • Need for condition surveys • Collection methodologies • Four basic types of condition surveys • Different procedures and equipment available
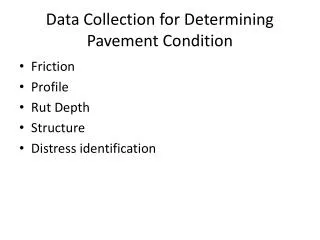
Need for Condition Surveys • Evaluate current condition of pavement • Determine rates of deterioration • Project future conditions • Determine maintenance & rehabilitation needs • Determine costs of repairs • Prepare plans for repairs
Types of Surveys • Distress Surveys • Structural Capacity • Roughness (Ride Quality) • Skid Resistance (Surface Friction)
Distress Surveys • Type of distress • Severity • Extent of distress present on the pavement
Distress Surveys Types • Paser • Paver • SHRP • Asphalt Institute • Texas Transportation Institute
Paser • Asphalt • Concrete • Gravel Roads
Paser Distress-Asphalt Uses visual inspection techniques Surface defects Surface deformation Cracks Patches and potholes
Paser Distress-Concrete • Uses Visual inspection techniques • Surface defects • Joints • Pavement cracks • Pavement deformation
LTPP Distress Asphalt Concrete
LTPP Distress-Asphalt Cracking Patching and potholes Surface deformations Surface defects Misc distress
LTPP Distress-Concrete Cracking Joint deficiencies Surface defects Misc distresses
Paver Distress Asphalt Concrete
Paver Distress-Asphalt Alligator cracking Block crack Distortions Longitudinal and transverse cracking Patching and utility cuts Rutting
Paver Distress- Concrete Blow-ups and Buckling Corner break D cracking Linear cracking Polished aggregate Pumping
Ride QualityIRI (International Roughness Index) IRI is calculated from longitudinal profile measured with a road profiler in both wheelpaths. The average IRI of the two wheelpaths is reported as the roughness of the pavement section.
ROUGHNESS SURVEY • Survey the outside lane. • For undivided highways survey one direction. • For divided highways survey the outside lane in both directions. • For each survey cycle use the same direction(s) of travel and survey lane(s).
IRI CALCULATION International Roughness Index (IRI) - The IRI is computed from a single longitudinal profile using a quarter-car simulation as described in the report, "On the Calculation of IRI from Longitudinal Road Profile." [Sayers 95]
Ride QualityRUT DEPTH MEASUREMENT 3 Rutting Sensors • 1.7 m
45 40 35 30 Percent of Measurements within the Section 25 20 15 10 5 0 Level 2 Level 1 Level 3 Level 4 Severity Level SAMPLE DATA AGGREGATION
Structural Capacity • Not routinely collected for pavement monitoring • Mainly used for selecting and designing rehabilitation strategies • Can reduce maintenance and rehabilitation costs
Structural EvaluationDestructive Testing • Coring • Laboratory testing • Excavation of pits • Field CBR
Structural EvaluationNon-Destructive Testing • Benkelman Beam • Dynaflect • Road Rater • FWD • Rolling Deflectometer • GPR
Automated Distress Surveys • Increase speed and ease of data collection • Reduce transcription errors • Increase consistency between classification and quantification • Increase safety of field crews
Automated Condition Survey Equipment • Used by most states to collect: • Pavement friction • Roughness • Profile • Rut depth • Deflection data
Classes of Automated Data Collection • Distress images collected on film or high resolution video and: • analyzed while the vehicle collects data • analyzed in the office after data collection • analyzed after data collection by viewing the images • Lasers are used to determine changes in surface texture
Rolling Weight Deflectometer • Primary objectives are: • Develop an RWD suitable for network level analysis • Collect data at speeds of 50 mph • Output will be a structural index • Measure maximum deflection, pavement temperature, station numbers, and day and time of test
Rolling Weight Deflectometer • Phase I • Identified deflection measurements • Phase II • Highway speeds • Deflection response converted to a structural index
Rolling Weight Deflectometer • Objective is to compare relative structural strengths • Identify weak links • Deflection basins, magnitudes, loads and temperatures • Processed in real time • Continuously measured at 1 foot intervals
Distress Data Collection • Visual survey • Laser technology • Film-based systems • Video systems
Drainage Surveys • Poor drainage causes poor pavement performance • Water on a pavement can: • create a hazard to motorists • saturate the subgrade soil • deteriorate the pavement
Load Load capacity can be increased by an overlay Moisture If proper drainage is not provided during rehabilitation, the same moisture related distress will recur Pavement failure is caused by:
Signs of Deficient Drainage • Standing water in ditchlines • Concentrated weed growth in ditchline or edge of pavement • Evidence of water ponding on shoulder • Deteriorated joint or crack sealants • Any evidence of pumping
How Much Data to Collect? • To support network-level analysis • Sampling processes • Two sampling procedures: • Network sampling • Section sampling
Network Sampling • Less samples needed when total number in the whole increases • To determine average condition: • Sample 2 - 5% • To predict the distribution of condition: • Sample 10 - 25% • To predict cost of repairs, restorations: • Sample 30 - 35% • Most states survey 10%
Section Sampling • To identify sections of pavement in a selected condition level, the condition of each section must be defined • If a windshield survey is used: • entire section should be inspected • If a walking or automated survey is used: • a portion of the section is adequate
Frequency of Surveys • Not all sections need to be inspected every year • Interstates and more important sections can be inspected every year • Sections with lower usage can be inspected every second or third year • Use of a condition project method to utilize a common period for analysis
Instructional Objectives • Need for condition surveys • Collection methodologies • Four basic types of condition surveys • Different procedures and equipment available