Assessing Constructed Forested Wetland Development Using Successional ( Performance ) Trajectories
Assessing Constructed Forested Wetland Development Using Successional ( Performance ) Trajectories Susan M. Carstenn Hawaii Pacific University Kaneohe, Hawaii Why Reference Wetlands? Restoration Strategies Endpoint…target….goal Assessment metrics Reference Wetlands

Assessing Constructed Forested Wetland Development Using Successional ( Performance ) Trajectories
E N D
Presentation Transcript
Assessing Constructed Forested Wetland Development Using Successional (Performance) Trajectories Susan M. CarstennHawaii Pacific UniversityKaneohe, Hawaii
Why Reference Wetlands? • Restoration Strategies • Endpoint…target….goal • Assessment metrics • Reference Wetlands • minimally adversely affected by anthropogenic activities • the wetland being destroyed as in the case of mitigation • old restoration project that has been deemed successful
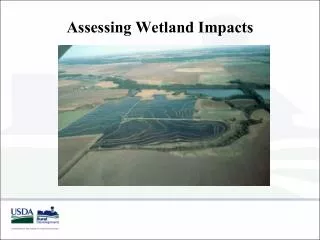
Constructed Forested Wetland Constructed Forested Wetland Natural Forested Wetlands
Why Trajectories? • Wetlands are dynamic ecosystems; therefore, static metrics are inappropriate assessment tools. • Reference wetlands serve as the target, but can not assess incremental progress towards the target. • Trajectories provide incremental targets.
Reference Wetland Approach The performance of a constructed wetland (stars) is compared to the mean ( standard error(s)) of a set of reference wetlands (green). Quality or Quantity Time
Reference Wetland Approach • Success is declared when the constructed wetland (stars) meets or exceeds the reference wetlands. • Wetlands developing at different rates are assessed with the same criteria. • The time required to replace wetland function is inconsequential. Quality or Quantity Time
Trajectory Approach • A constructed wetland (star) is compared to the mean of all previously constructed wetlands (green). • Success is declared when a newly constructed wetland (stars) falls within the 95% predication intervals around the mean of all previously constructed wetlands (green). Quality or Quantity Time
Trajectory Approach A wetland demonstrates suboptimal development…then what? Success is declared when a newly constructed wetland (stars) falls within the 95% predication intervals around the mean of all previously constructed wetlands (green). Quality or Quantity The orange line represents the timing of a redemediation action e.g., supplemental planting, fertilization, or understory seeding. Time
Trajectory Construction • Space for Time Substitution • A chronosequence of wetlands • Array of metrics measured once • Individual Wetland Trajectories • Many newly constructed wetlands • Metrics monitored over time
Canopy Trees Height Diameter at breast height (dbh) Size class distributions (dbh) Community basal area Canopy cover Stem density Species richness Species diversity Subcanopy Trees and Shrubs Stem density Diameter at breast height Species richness Species diversity Herbaceous Species Species richness Species diversity Understory Species Canopy and subcanopy seedling richness and frequency of occurrence Vine species richness and frequency of occurrence Functional group richness and frequency of occurrence Soils Soil water content Bulk density Organic Matter Particle size analysis Assessment Metrics
Assessment Metrics • Emerging Properties • Hierarchical size class frequency distributions of tree diameters • Changes in frequency of occurrence of vegetation structural categories with age • Increasing organic matter associated with increases in soil water content • Decreasing bulk density associated with increasing organic matter content
Assessment Metrics • Emerging Properties • Hierarchical size class frequency distributions of tree diameters • Changes in frequency of occurrence of vegetation structural categories with age • Increasing organic matter associated with increases in soil water content • Decreasing bulk density associated with increasing organic matter content
Results – Individual Metrics • Canopy Trees • height (r2 = 0.81; p < 0.05) • diameter at breast height (r2 = 0.80; p < 0.05) • stand basal area (r2 = 0.75; p < 0.05) • canopy cover (r2 = 0.77; p < 0.05) • Subcanopy Trees (Ilex cassine) • diameter at breast height (r2 = 0.64; p < 0.05) • stand basal area (r2 = 0.75; p < 0.05) • Shrubs and Understory • no significant trajectories
Hydrogeomorphic Classes • Depressional • isolated • riparian • headwater • Lake Fringing • littoral • Stream Floodplain • bordering an incised channel www.geog.psu.edu/wetlands/manual/image13.gif
Results – Emerging Properties Natural Wetland
Results – Emerging Properties 5 Years Old 18 Years Old Natural Wetland
Discussion • Challenges • Selecting data collection methods to support comparisons • across developmental stages • with literature values
Discussion • Canopy trees • height • approach values of natural wetland • fall short of literature values • dbh • sites > 12 years old met or exceeded literature values • stand basal area • only the oldest sites approached literature values • Subcanopy trees • Myrica cerifera andSalix caroliniana similar to literature values • Ilex cassine and Persea palustris fall below literature values
Discussion • Shrubs • lower species richness • similar frequency, dbh, and density • Understory • similar to richness of cypress domes and bayheads, but less than hardwood swamps and marshes. • Soil • weak, but significant trends in organic matter
Conclusions • Canopy tree development alone may not indicate restoration success; it suggests that the site is developing conditions indicative of a mature forest. • Subcanopy, shrub, and understory • community structure is approaching those of wetlands described in the literature. • richness and diversity is on the low end of the range of reported in the literature.
Conclusions • The trajectory approach shows great promise. • In spite of the added variation inherent in the space-for-time substitution, highly significant trends were detected. • Uniform data collection methods should be established. • How much time should be allocated for a wetland to meet a particular assessment criterion?