Network Forensics
Network Forensics. Networking Basics Collecting Network-Based Evidence (NBE) Collection of Packets using Tools Windows Intrusion UNIX Intrusion. OSI Layers. Taken from Forouzan: TCP/IP Protocol Suite. Source to Destination Delivery. Taken from Forouzan: TCP/IP Protocol Suite.

Network Forensics
E N D
Presentation Transcript
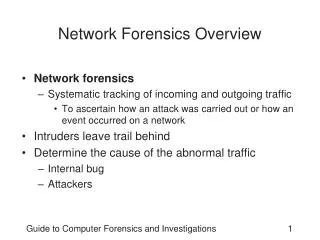
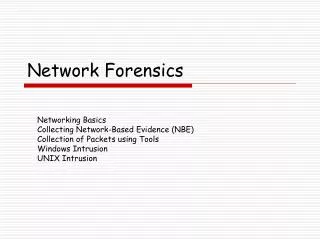
Network Forensics Networking Basics Collecting Network-Based Evidence (NBE) Collection of Packets using Tools Windows Intrusion UNIX Intrusion
OSI Layers Taken from Forouzan: TCP/IP Protocol Suite
Source to Destination Delivery Taken from Forouzan: TCP/IP Protocol Suite
Physical Addresses A node with physical address 10 sends a frame to a node with physical address 87. The two nodes are connected by a link. At the data link level this frame contains physical (link) addresses in the header. These are the only addresses needed. The rest of the header contains other information needed at this level. The trailer usually contains bits needed for error detection. Taken from Forouzan: TCP/IP Protocol Suite
Physical Addresses Also called mac addresses... Most local area networks use a 48-bit (6 bytes) physical address written as 12 hexadecimal digits, with every byte separated by a colon as shown below: 7B : 05 : 4C : A9 : 62 : 83
IP Addresses As the message moves through the Internet, notice how the IP addresses stay the same, but the physical addresses change. Why are physical addresses not sufficient? Taken from Forouzan: TCP/IP Protocol Suite
IP Addresses Also called network address, logical address An Internet address (network address, logical address) is 32 bits in length, normally written as four decimal numbers, with each number representing 1 byte. The numbers are separated by a dot, thus the notation is often called dotted decimal notation. 179. 84. 31. 8
Port Addresses A port address uniquely identifies a network application such as http, email, ftp, etc. and is a 16-bit decimal number such as 176. Taken from Forouzan: TCP/IP Protocol Suite
Collecting Network-Based Evidence • Types of NBE • Full content data • Every packet is captured • Excellent for analysis, but requires much work • Session data • Summaries of data transfer, including time and duration of transfer, and parties involved • Alert data • Responding to occurrence of a keyword (shipment) • Statistical data • Examining which services or protocols are being used more and for longer periods of time
Evidence Collection • NBE collected: • Before a compromise: proactive network security monitoring (NSM) • During a compromise: reactive NSM
Standard Intrusion Attack • Intrusion Phases • Reconnaissance: intruder (1st IP address)checks connectivity and vulnerabilities of Web server (victim) • Exploitation: launch attack from 2nd IP address against Web server • Reinforcement: store tools at 3rd IP address, connect to Web server (backdoor) • Consolidation: intruder communicates with backdoor using 4th IP address • Pillage: sensitive information is stolen, or base built for further attacks Taken from Jones, et al Real Digital Forensics
Attack Phases IP Address 1 IP Address 2 Phase 1: Reconnaissance Phase 2: Exploitation Phase 3: Reinforcement IP Address 3 Victim Phase 4: Consolidation Phase 5: Pillage IP Address 4 IP Address 5?
Gaining access to network traffic • Hubs • A hub forwards a packet to all ports other than the one that received it, thus, all traffic passing by can be seen and collected • Taps • Test Access Ports are placed between a firewall and router or between switches; cost is ~ 4 or 5 times that of hubs • Inline device – homemade tap; computer that supports bridging • Switched Port Analyzer (SPAN port) – copy to a mirror port on the switch
Tools • Full Content: Tcpdump, Ethereal, Flowgrep, hexdump • Session: Argus can also run in live mode, Tcptrace • Alert: Snort, Bro • Statistical: Tcpdstat, Tcpstat
Windows Intrusion • Situation • BankTwo collected network-based evidence while troubleshooting a network problem. The bank did not have a full suite of security monitoring tools, but it was collecting full content data to learn about the network’s performance. • Tcpdump was running on a Linux monitoring platform sitting on a hub with visibility to the victim system 103.98.91.41.
Using Tcpdump The command used: tcpdump –n –i eth0 –s 1515 –w capture_file.lpc -n disables translation of IP addresses to host names and port numbers to service names -i eth0 specifies running against the promiscuous interface (receives all packets on the network segment) -w capture_file.lps writes the output to a file on the monitoring station’s hard drive
Statistical Data using Tcpdstat The command: tcpdstat s2a.lpc > s2a.tcpdstat.txt Generates: number of packets, average rate, # of source and destination pairs and protocols used DumpFile: s2a.lpc FileSize: 8.21MB Id: 200309231852 StartTime: Tue Apr 08 12:03:29 2009 EndTime: Tue Apr 08 12:03:29 2009 TotalTime: # of packets: 26084 (7.81MB) AvgRate: 1.10Mbps stddev:0.56M ### IP address information ### # of IPv4 addresses: 4 File size Rate
Statistical Data using Tcpdstat ### Protocol Breakdown ### protocol packets bytes bytes/pkt ----------------------------------- [0] total 26084 (100%) 8187014 (100%) 313.87 [1] ip 26084 (100%) 8187014 (100%) 313.87 [2] tcp 26077 (99.97%) 8186206 (99.9%) 313.92 [3] http(s) 11344 (43.49%) 6914617 (84.46%) 609.54 [3] http(c) 11491 (44.05%) 1076775 (13.15%) 93.71 [3] squid 4 (0.02%) 240 (0.00%) 60.00 [3] smtp 3 (0.01%) 180 (0.00%) 60.00 [3] ftp 2 (0.01%) 120 (0.00%) 60.00 [3] telnet 2 (0.01%) 120 (0.00%) 60.09 ... [3] other 3213 (12.32%) 193074 (2.36%) 60.00 [3] udp 4 (0.02%) 618 (0.01%) 154.50 ... Notice web servers sending 43.49% of packets, web clients sending 44.05%, and “other” sending 12.32%.
Alert data using Snort [**] [1:1668:5] WEB-CGI /cgi/bin/ access [**] [Classification: Web Application Attack] [Priority:1] 04/08-12:03:29 322441 95.16.3.79:51767 -> 103.98.91.41:80 TCP TTL:63 TOS:0x0 ID:13538 IpLen:20 DgmLen:181 DF ***AP*** Seq: 0xA50D689C Ack: 0x1EDB04F1 Win: 0x8218 TcpLen:32 TCP Options (3) => NOP NOP TS: 1462497415 0 [**] [1:1201:6] ATTACK RESPONSES 403 FORBIDDEN [**] [Classification: Attempted Information Leak] [Priority:2] 04/08-12:03:29 421027 103.98.91.41:80 -> 95.16.3.79:51773 -> 103.98.91.41:80 TCP TTL:128 TOS:0x0 ID:516 IpLen:20 DgmLen:386 DF ***AP*** Seq: 0x1EDFB033 Ack: 0x7E945F39 Win: 0x43EF TcpLen:32 TCP Options (3) => NOP NOP TS: 120360 1462497415 Source IP @ is 95.16.3.79 and destination is 103.98.91.41 – the victim Web server. This looks like pre-attack reconnaissance against the Web server.
Session data using Argus Transform the data into session data: argus –d -r s2a.lpc –w s2a.argus // -d run in background // -r read from filename //-w write Argus results to file Next, run Argus’ ra client to view it in text-based form: ra –a –c –n –r s2a.argus | grep –v drops > s2a.argus.all.txt // -a give summary statistics // -c count bytes in packets // grep –v remove status rpt Date Time Proto SourceIP.Port DestIP.Port SrcPkts DstPkts SrcBytes DestBytes Session Close 08 Apr 09 12:03:29 tcp 95.16.3.23.1044 -> 103.98.91.41.80 6 7 906 4909 EST 08 Apr 09 12:04:41 tcp 95.16.3.70.53236 -> 103.98.91.41.80 6 6 545 3791 FIN ...scanning for web vulnerabilities
Session data using Argus ...later Date Time Proto SourceIP.Port DestIP.Port SrcPkts DstPkts SrcBytes DestBytes Session Close 08 Apr 09 12:04:41 tcp 95.16.3.23.47990 -> 103.98.91.41.1359 1 1 54 54 RST 08 Apr 09 12:04:41 tcp 95.16.3.70.47990 -> 103.98.91.41.305 1 1 54 54 RST 08 Apr 09 12:04:41 tcp 95.16.3.23.47990 -> 103.98.91.41.698 1 1 54 54 RST 08 Apr 09 12:04:41 tcp 95.16.3.70.47990 -> 103.98.91.41.155 1 1 54 54 RST ... Notice that only the port number differs in each transmission. This pattern indicates port scanning, searching for open ports. If one is found open, the sender could try to make a connection...