Download
1 / 18
180 likes | 448 Vues
PRESENTATION ON THIRSTY CROP BY WWF-INDIA. Structure of Presentation. Water & Agriculture Water Consumption by Thirsty Crop Thirsty Crops Challenges Addressing the Challenges Framework Project Area Area Description Project Process Results Project Outcome

E N D
Structure of Presentation • Water & Agriculture • Water Consumption by Thirsty Crop • Thirsty Crops • Challenges • Addressing the Challenges • Framework • Project Area • Area Description • Project Process • Results • Project Outcome • Project Potential • Project Impact
Water & Agriculture in India • Irrigation consumes more than 80% of the available water in the country Source: indiastat.com (1997)
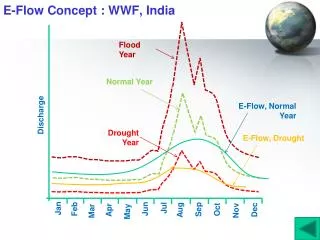
Water & Agriculture in India (cont) • Changing trend of water availability… evident from adequate to stress and will strike to scarcity within a span of 75 years
……..WHY THIRSTY ARE SOME CROPS • Heavy requirement of water per unit yield of produce • Blue water • Green Water • Grey water • Identified Thirsty Crops • Sugarcane: 1500 – 3000 litres/kg of cane • Cotton: 7000 – 29000 litres/kg of fibre • Rice: 3000 – 5000 litres/kg of grain • Basis of identification • Usage of water • Usage of inputs and thereby losses • Area under cultivation
Challenges • PRODUCE MORE WITH LESS • Proper farm water management • Introducing concept of Integrated Plant Nutrient Management • Promote practice of Integrated Pest Management at farm level
Addressing the Challenges • WWF-India’s Initiative • Sustainable Cotton Initiative Project in Andhra Pradesh & Maharastra • Sustainable Sugar Initiative Project in Maharastra
Available Water Fertilizer Impact Water to be retained for other ecosystem functions Market transforming towards sustainable production base Improved livelihoods for the producer Pesticide Outcome Farmers adapted to BMPs The concept of producing better cotton/sugar gaining momentum Results Improve water productivity Reduction in chemical input Improve in gross margin Thirsty Crop Better Management Practices on Thirsty Crop FRAMEWORK
Project Area • Warrangal (Andhra Pradesh) • Aurangabad (Maharastra)
Implementation Approach AREA DESCRIPTION • Dominated by crops like Paddy, Cotton & Sugarcane • Region is marked by huge consumption of chemical pesticide (ranging from 30 – 50% of the respective state consumption) • Traditional water use in agriculture taking a heavy toll on ground water (e.g. flood irrigation, serpentine furrows) • Majority of the area is technically unintervened • Area comes under Godavari basin, a priority basin for WWF agri & water works
Implementation Approach PROJECT PROCESS • Development of Better Management Practices for each of the thirsty crops under the following guiding principles • Improving water productivity • Reduction in chemical fertilizers • Lessening use of pesticides • Improving gross margin of the farmers
Implementation Approach PROJECT PROCESS (Cont) • Demonstration of trial plot • Raising of Demonstration plot • BMP demonstrated through implementing partners • Awareness campaign through Farmers’ Field School /Learning Group/Farmers’ Group • Creating Resource Centre • Formation of Society under Cooperative act • Outcome monitored by M&E partner
RESULTS Sugarcane • 48% of water reduction in BMP fields • Improvement in juice quality • 21% of reduction in chemical fertilizer • An extra profit of Rs 4700/- per acre/BMP farmer (Source: NABARD report) Cotton • 49.4% of water reduction in BMP fields • 81% lessening of chemical pesticides in BMP field • 18% of reduction in chemical fertilizer • An extra profit of Rs 4000/- per acre/BMP farmer (Source: CRIDA report)
Implementation Approach PROJECT OUTCOME • Around 17000 ha of cotton growing area & 8000 ha of cane area would be under BMP • Farmers’ shifting towards micro irrigation to improve water productivity & profit per unit of water • The success story has laid down the concept of producing better cotton/sugar through an environmentally sustainable crop production system….and gaining momentum • Industry promoting practices which is environmentally sustainable
Implementation Approach PROJECT POTENTIAL Project Potential • Water use efficiency : 75 – 90% • 14.7 BCM of water can be saved annually in cotton cultivation • 37 BCM of water can be saved annually in cane cultivation Usual Scenario • Water use efficiency : 40 – 50% • 30 BCM of water annually is provided to cotton • 78 BCM of water annually is provided to sugarcane crop
Implementation Approach PROJECT IMPACT • Water to be retained for functioning of other ecosystem services • Water quality to be restored • Improved livelihoods for the farmers • Attaining commodity market stability through optimum resource utilization