Global E-Waste Infographic
This infographic provides real citations on how e-waste is effecting our world.


Global E-Waste Infographic
E N D
Presentation Transcript
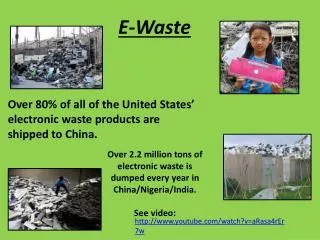
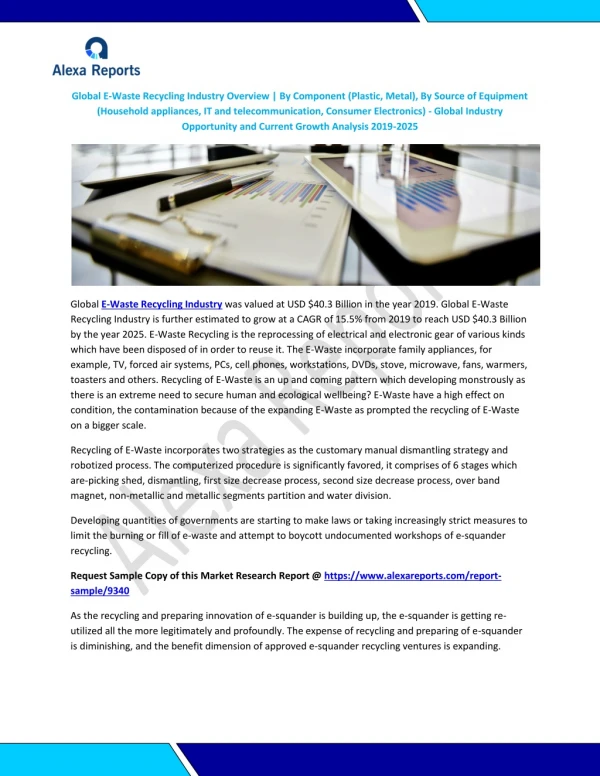
GLOBAL E-WASTE IS SURGING Why these numbers matter for recycling and sustainability efforts Electronic waste (e-waste) is piling up faster than ever before, creating both an environmental crisis and a massive missed opportunity for resource recovery. In just the past decade, global e-waste has skyrocketed—yet the majority of it still isn’t being recycled. Understanding the scale of the problem is the first step toward creating effective recycling solutions and protecting the planet’s resources. Statistics Global e-waste hit 62 million tons in 2022 — up 82% since 2010. On track to reach 82 million tons by 2030, growing 2.6 million tons each year. Billions in valuable materials lost; only 1% of rare earth demand met by recycling. Equivalent to 1.55 million 40-tonne trucks circling the equator. Only 22.3% was properly recycled, leaving $62 billion in resources unaccounted for. (Source: ITU & UNITAR) Forests for the Future In partnership with local communities, we expanded reforestation efforts in Indonesia and Brazil focusing on BlueWave Cleanup Over 3,000 volunteers participated in our global shoreline campaigns, removing harmful waste and