1 / 10
0 likes | 4 Vues
Understand how the Supertrend indicator helps identify market direction and generate accurate buy or sell signals. This guide explains its working, benefits, and how to use it effectively. <br><br>Read more: https://blog.elearnmarkets.com/supertrend-indicator-strategy-trading/

E N D
Search... Courses Webinars Stories Language GET FREE COURSE BASIC FINANCE DERIVATIVES FINANCIAL PLANNING FUNDAMENTAL ANALYSIS TECHNICAL ANALYSIS MUTUAL FUNDS MARKETSHALA MISCELLANEOUS Home Technical Analysis Supertrend Indicator : How to use for Intraday trading? 5 by Vivek Bajaj — June 17, 2025 in Technical Analysis Reading Time: 14 mins read 319.7k VIEWS Share on Facebook Share on X Share on WhatsApp A very common problem with intraday traders is which indicators work well for the intraday trades. Being an intraday trader, chances are that you use technical analysis to identify trades based on different parameters. However, the first indicator which comes to our mind forintraday trading is the Supertrend indicator due to its simplicity. It can give you precise buy or sell signals in a trending market along with the best super trend strategy for intraday.
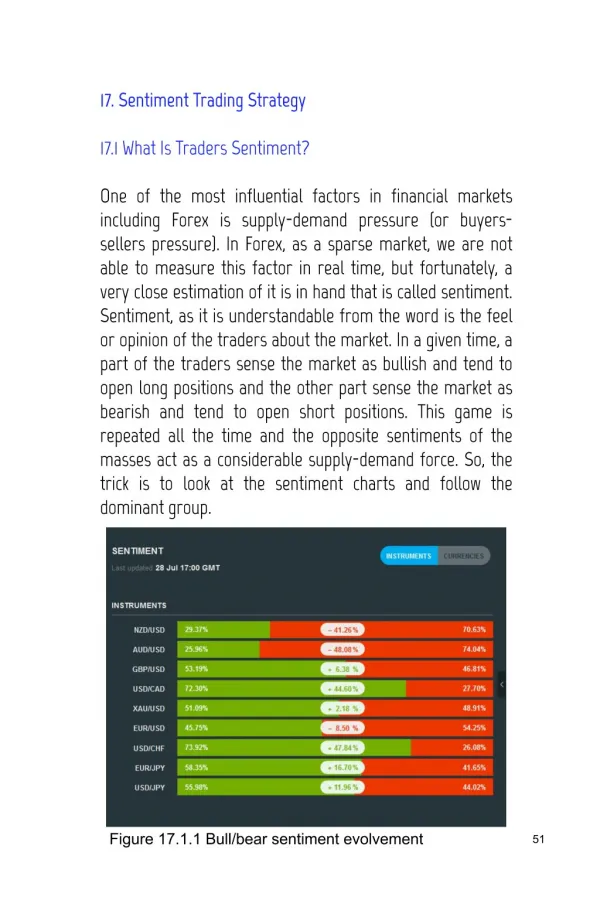
Table Of Contents What is the Supertrend indicator? Why is Supertrend Important? How to Use the Supertrend Indicator? Best Supertrend Indicator Settings Supertrend Indicator Formula How to identify buy and sell signal using supertrend indicators? Intraday Trading Strategies using Supertrend Trading Strategy 1: Supertrend Breakout Trading Strategy 2: Supertrend Pullback Trading Strategy 3: Supertrend Range Breakout Trading Strategy 4: Supertrend Reversal Swing Trading and Long Term Strategies with Supertrend Trading Strategy 1: Supertrend Trend Following Trading Strategy 2: Supertrend Breakout for Swing Trading Trading strategy using Supertrend and Moving Average Crossover Best Timeframe to Use in Supertrend Indicator Pros and Cons of Supertrend Indicator Watch the video to learn more about this indicator: Bottomline Frequently Asked Questions How accurate is supertrend strategy? How is SuperTrend indicator calculated? How can I use Supertrend indicator for intraday trading? What timeframe and setting is best for supertrend indicator for day trading? In stock market Supertrend indicator 7 3 is equal to moving average? What is the Supertrend indicator? A Super Trend is a trend following indicator similar to moving averages. It is plotted on price and the current trend can simply be determined by its placement vis-a-vis price. It is a very simple indicator and is constructed with the help of just two parameters- period and multiplier. When we construct the Supertrend indicator strategy, the default parameters are 10 for the Average True Range (ATR) and 3 for its multiplier. The average true range (ATR) plays a key role in ‘Supertrend’ as the indicator uses ATR to compute its value and it signals the degree of price volatility. Why is Supertrend Important? Determining the direction of the dominant trend in the market is the main function of the Supertrend indicator. It establishes whether a trend is bullish or bearish by combining price activity and volatility. This aids traders in following the direction of the prevailing market, which is a key element of profitable trend trading. How to Use the Supertrend Indicator? To use this indicator, you need to open the chart of a particular stock that you want to track and set a time interval of 10 minutes when doing intraday trading. You can use any good charting software. After opening the chart, insert supertrend and keep the settings as 10 and 3. You can also insert your own settings as well. However, while you using this indicator, you should not avoid putting your stop loss.
For a long position, you can put stop loss right at the green indicator line. For a short position, you can put it at the red indicator line. Using a supertrend along with a stop-loss pattern is the best way to earn the best wealth in trading. Best Supertrend Indicator Settings The default parameter is a period of 10 and 3. You should note that any changes to these numbers can affect the use of the Supertrend indicator. There is no best setting for any trading indicator. As well, the more settings you change can lead to a trading system that is over-optimized for that point in time. You should note the following points; Smaller settings can make the indicator more reactive to the price, which means more signals Higher settings will remove the noise from the market at the risk of fewer trading signals Supertrend Indicator Formula The supertrend indicator calculation is shown below– Up = (high + low / 2 + multiplier x ATR Down = (high + low) / 2 – multiplier x ATR Calculation of Average True Range – [(Prior ATR x 13) + Current TR] / 14 Here, 14 indicates a period. Hence, the ATR is derived by multiplying the previous ATR with 13. Add the latest TR and divide it by period. Thus, ATR plays an important role in the supertrend technical analysis indicator. How to identify buy and sell signal using supertrend indicators? Super Trend being a trending indicator works beautifully in trending markets (both uptrends and downtrends). The buy-sell signal can easily be identified when the indicator flips over the closing price. A buy signal is generated when the Super Trend closes below the price and the color changes to green. On the other hand, a sell signal is made when the Super Trend closes above the price and the color of Super Trend turns red. There’s no technical indicator which can be 100% accurate and so is Super Trend also. It also generates false signals in the sideways market, though it gives lesser false signals as compared to other indicators. So you can combine Super Trend with other indicators to get better trading signals. Intraday Trading Strategies using Supertrend During a single trading day, intraday trading methods that employ the Supertrend indicator can be useful for spotting trend-based opportunities and catching brief price swings. Here are four Supertrend-based intraday trading techniques: Trading Strategy 1: Supertrend Breakout Trade on Supertrend breakthrough indications to take advantage of big market momentum developments. Steps: Configuration: Utilize the Supertrend indicator on a 5-minute or 15-minute intraday chart.Determine the Supertrend’s direction (bearish or bullish) based on the signal from
the indicator. Entry Requirement: When the Supertrend reverses course, look for a breakthrough above (for long trades) or below (for short trades) the previous high/low. Verify the breakout using momentum indicators (e.g., RSI, MACD) and higher volume. Exit Requirements: Aim for a price based on significant resistance/support levels or recent price fluctuations. If the trend turns back, use a trailing stop-loss or the opposite Supertrend signal to exit the trade. Trading Strategy 2: Supertrend Pullback When there are brief retracements within the general trend direction, enter trades at advantageous price points. Steps: Setup: Use the Supertrend indicator to determine the direction of the current trend.Await price pullbacks or retracements that go counter to the trend. Trading Criteria: Whenever the price retracement hits a significant level of support (for long trades) or resistance (for short trades) that is in line with the Supertrend direction, it is time to enter the trade. For confirmation of the trend’s possible continuation or reversal, use candlestick patterns or other technical indicators. Exit Requirements: Decide on your profit goals based on the opposing Supertrend signal or levels of nearby resistance and support. To reduce losses and preserve profits, use a trailing stop-loss. Trading Strategy 3: Supertrend Range Breakout Trade breakouts with the Supertrend indicator from range-bound market circumstances. Steps: Setup: Using the Supertrend indicator, pinpoint times of consolidation or sideways movement. Await a breakout that occurs above or below the range limits. Entry Requirement: Trade when the price breaks out of the range and the Supertrend confirms it (a shift in direction). Use momentum indicators and higher volume to confirm the breakout. Exit Criteria: Determine profit targets by looking at recent price fluctuations or the breadth of the range. If the breakout holds, use a trailing stop-loss to profit from further gains. Trading Strategy 4: Supertrend Reversal Use the Supertrend indicator to spot possible trend reversals and seize countertrend trades. Steps: Setup: Keep an eye out for indications of fatigue or deviation from the main trend in the Supertrend.Search for candlestick patterns or chart formations that might indicate a reversal. Requirements for Entry: When the Supertrend swings in the opposite direction of the dominant trend—that is, from bullish to bearish or vice versa—you should enter a trade. Use additional technical indicators or price action patterns to validate the reversal signal. Exit Requirements: Decide on your profit goals based on the opposing Supertrend signal or levels of close support and resistance.To control risk in the event that the reversal is brief, use a tight stop-loss.
Swing Trading and Long Term Strategies with Supertrend For capturing long-term trends and optimizing earnings over time, swing trading and long-term methods utilizing the Supertrend indicator can be useful. Using the Supertrend indicator, the following four techniques are designed for long-term investing and swing trading: Trading Strategy 1: Supertrend Trend Following As your main trend-following tool, use the Supertrend indicator to identify and capture medium- to long-term patterns. Steps: Configuration: Utilizing a medium- to long-term chart (daily or weekly, for example), apply the Supertrend indicator.To ascertain the main trend, identify the Supertrend’s direction (bearish or bullish). Requirements for Entry: When price retraces to a good level within the prevailing trend (e.g., near the Supertrend line), enter trades in the direction of the Supertrend. To corroborate the trend direction, look for additional confirmation from other technical indicators (such as moving averages and RSI). Exit Requirements:When the trend begins to show indications of fatigue or reversal, use the opposing Supertrend signal or a trailing stop-loss to exit trades. Hold onto your positions until there is a definite evidence of a trend reversal or a noteworthy development. Trading Strategy 2: Supertrend Breakout for Swing Trading Use the Supertrend indicator to spot breakouts and profit from swing trading chances. Steps: Setup: Keep an eye on the Supertrend indicator on a medium-term chart (such as a daily or 4-hour chart). Await a consolidation of the price inside a specific range or pattern. Requirements for Entry: Trade entry is indicated by a shift in the direction of the Supertrend when the price breaks out above or below the consolidation range. To verify the breakout, use momentum indicators and volume analysis. Exit Requirements: Profit targets can be established using technical levels (e.g., Fibonacci retracement levels, prior swing highs/lows) or the predicted range of the breakout. Use a trailing stop-loss to safeguard profits and profit from future trend extensions. Trading strategy using Supertrend and Moving Average Crossover This is the best EMA crossover for intraday. This strategy basically comprises of Super Trend and 5-20 EMA crossover. When the Super Trend turns green (i.e. Super Trend is below the price) and 5 EMA is above 20 EMA, a buy signal is generated. Similarly, when the Super Trend turns red (i.e. Super Trend is above the price) and 20 EMA is above 5 EMA, a sell signal is generated. Below is the chart of Nifty. The buy signals are shown with the help of green arrows and the sell signal is shown with the help of red arrows. As you can see in the chart that you can really catch big moves based on this strategy and keep trailing stop loss with the help of Super Trend to protect your profits.
Best Timeframe to Use in Supertrend Indicator As for swing traders and position holders, they can use longer timeframes. This indicator can also be used on multiple timeframes where you place it on a larger timeframe then go down to a lower timeframe and use it for entry and exit signals. The lowest timeframe you should use is the 15-minute chart. Pros and Cons of Supertrend Indicator Supertrend gives accurate signals on precise time. Also, the indicator is available on various trading platforms free of cost. The indicator helps the intraday traders to make faster decisions. It is simple to use and understand. However, the indicator is not appropriate for all the market phases, It works best when the market is trending. You can watch the video below to get a better idea of the concept and use of Supertrend indicator: A Super Trend indicator can be used on equities, forex, or futures on various time frames including hourly, daily, weekly, etc. However, Super Trend needs to be used in conjunction with other indicators like RSI, Parabolic SAR, MACD, etc to receive filtered signals. Moreover, Supertrend also works as a trailing stop-loss for the existing trades and acts as strong support or resistance. You can also use Supertrend Scans in StockEdge– Watch the video to learn more about this indicator:
Stock सेसही time पेक ै सेिनकल? ? | Learn Supertrend Indicator #Learn2trade Ses… … Stock सेसही time पेक ै सेिनकल? ? | Learn Supertrend Indicator #Learn2trade Ses Teilen Teilen Ansehen auf Learn Supertrend Indicator for successful intraday trading. Enroll now to learn trading online course and elevate your trading skills! Bottomline A Super Trend is a trend following indicator similar to moving averages. This indicator can also be used on multiple timeframes where you place it on a larger timeframe then go down to a lower timeframe and use it for entry and exit signals. Supertrend gives accurate signals on precise time. Also, the indicator is available on various trading platforms free of cost. Visit this blog: https://blog.elearnmarkets.com/supertrend-indicator-strategy-trading/ Frequently Asked Questions How accurate is supertrend strategy? There’s no technical indicator which can be 100% accurate and so is Super Trend also. It also generates false signals in the sideways market, though it gives lesser false signals as compared to other indicators How is SuperTrend indicator calculated? The supertrend indicator calculation is shown below– Up = (high + low / 2 + multiplier x ATR Down = (high + low) / 2 – multiplier x ATR Calculation of Average True Range – [(Prior ATR x 13) + Current TR] / 14 Here, 14 indicates a period. Hence, the ATR is derived by multiplying the previous ATR with 13. Add the latest TR and divide it by period. Thus, ATR plays an important role in the supertrend technical analysis indicator. How can I use Supertrend indicator for intraday trading? For using this indicator, you need to open the chart of a particular stock that you want to track and set a time interval of 10 minutes when doing intraday trading. You can use any good charting software. After opening the chart insert supertrend and keep the settings as 10 and 3. What timeframe and setting is best for supertrend indicator for day trading? The default parameter is a period of 10 and 3. In stock market Supertrend indicator 7 3 is equal to moving average? No it is not equal. 7 denotes the ATR value of last 7 candlesticks and 3 is the multiplier Continue Learning
Tags: average true range english rsi supertrend indicator strategy technical analysis Share Tweet Send Previous Post Next Post A Guide on Modern Portfolio Theory (MPT) 35 Essential Candlestick Chart Patterns Used By Smart Traders Vivek Bajaj Mr. Vivek Bajaj has over 18 years of trading experience in equities, options, currencies, and commodity markets. He is the co-founder of Stockedge and Elearnmarkets and is passionate about data, analytics, and technology. He serves on various exchange committees and has played a significant role in the evolution of India's derivative market. He has been a speaker at various colleges and higher institutions, including IIT and IIMs. Related Posts TECHNICAL ANALYSIS TECHNICAL ANALYSIS What is Slippage in Trading? Meaning & Examples Top 5 Breakout Trading Strategies MARCH 12, 2025 1.3K MARCH 28, 2025 387 TECHNICAL ANALYSIS TECHNICAL ANALYSIS 5 Stocks to Buy Today That Could Beat the NIFTY in 2025! What is a Margin Trading Facility? Advantages & Risks MAY 5, 2025 468 APRIL 4, 2025 872
Comments 5 4 years ago Aditya If I’m doing options trading on indices, is it a good idea to use supertrend on the options chart? Reply 4 years ago Sakshi Agarwal Hi, Supertrend can be used in the options chart as well. Thank you for Reading our blog. Reply 4 years ago Ashok Ahire All blogs are very nice and helpful but for common man can’t understand English language. So I request please if translations in hindi are available is better .. Thanks. Reply 4 years ago Sakshi Agarwal Hi, We really appreciated that you liked our blog! Thank you for your feedback! Keep Reading! Reply 1 year ago Arvind Kumar most important and useful tool.Happpy to read this article. Reply Leave a Reply Your email address will not be published. Required fields are marked * Comment * Name * Email * POST COMMENT Disclaimer Elearnmarkets (Kredent InfoEdge Pvt. Ltd.) is a SEBI-registered Research Analyst (RA) entity (SEBI Registration No.: INH300007493). The information provided in this article is for educational and informational purposes only and should not be considered as an offer to buy or sell any securities or investment products. The stocks, securities, and investment instruments mentioned herein are not recommendations under SEBI (Research Analysts) Regulations, 2014. Readers are advised to conduct their own due diligence and seek independent financial advice before making any investment decisions.
Investments in securities markets are subject to market risks. Please read all related documents carefully before investing. Investing in Equity Shares, Derivatives, Mutual Funds, or other instruments carry inherent risks, including potential loss of capital. Elearnmarkets (Kredent InfoEdge Pvt. Ltd.) does not provide any guarantee or assurance of returns on any investments. Past performance is not indicative of future performance. Register on Elearnmarkets Categories Continue your financial learning by creating your own account on Elearnmarkets.com Basic Finance Derivatives Financial Planning REGISTER FREE ACCOUNT Follow Us Fundamental Analysis Download App Technical Analysis Mutual Funds Miscellaneous Popular On Elearnmarkets Market Superheroes: Vivek Bajaj Chetan Panchamia Ashish Kyal Premal Parekh Abhijit Paul Jegan Sivakumar Jayachadran Jyoti Budhia Vivek Gadodia Vishal Mehta Piyush Chaudhry Santosh Pasi Gomathi Shankar Courses: Options Trading Dow Theory Momentum Trading Stock Investing Harmonic Chart Patterns Algo Trading Elliot Wave Theory Advanced Excel Cryptocurrency NSE Certification Course Webinars: Bank Nifty Scalping Intraday Trading Strategies Options Trading Strategies Options selling Price Action Relative Strength Tax Planning Options Buying Growth Stocks Portfolio Management Risk Management Renko Charts Crude Oil Traders Psychology Moving Average Multibagger Stocks Free Learning Modules: Intraday Trading Options Scalping Swing Trading Financial Modelling RSI Indicator Bollinger Bands Pricing of Futures Personal Finance Initial Public Offerings (IPO) Value Investing Technical Indicators Candlesticks Chart Patterns Option Greeks ELSS Funds Banking and Insurance Real Estate Gold Book Summaries: Rich Dad Poor Dad Psychology of Money The Intelligent Investor The Richest Man in Babylon Think and Trade Like a Champion Value Investing and Behavioural Finance Trading in the Zone Learn to Earn Tools: CAGR Calculator SIP Calculator eLearnOptions Future Value Calculator Present Value Calculator Atal Pension Yojana Cost of Delay Calculator Become a Crorepati © 2025 Elearnmarkets. All Rights Reserved Visit Elearnmarkets Courses Webinars Financial Guides Get Free Counselling