
telco
E N D
Presentation Transcript
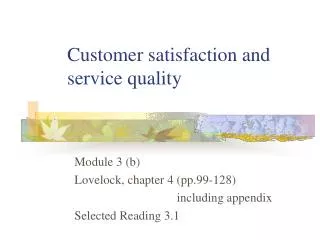
Customer satisfaction and service quality Module 3 (b) Lovelock, chapter 4 (pp.99-128) including appendix Selected Reading 3.1
Satisfaction and service quality Prior attitude PSQ t-1 PSQ t+1 CS or DS Expectations Disconfirmation Performance
CS/D with various service encounters PSQ, CS/D Existing level of PSQ Revised PSQ perceptions Time Figure 4.7 Relationship between satisfaction and service quality
Lecture overview • Measuring service quality • ServQual model • Gaps model of service quality • Reasons for the gaps • Strategies for closing the gaps • Measure customer satisfaction
Group activity: What is good customer service? • What comprises ‘good’ customer service? • Could one group member please describe one ‘good’ customer service experience • What made it ‘good’? • Could one group member please describe one ‘bad’ customer service experience • What made it ‘bad’?
Measuring service quality: SERVQUAL Model(Parasuraman, Zeithaml & Berry 1985, 1988) Reliability Responsiveness Service Quality Assurance Empathy Tangibles
ServQual dimensions • Refer to table 4.1, p. 101 • Reliability • dependability • delivering on promises • accuracy • consistency • Responsiveness • promptness • helpfulness Get it right the first time! and on time!
I feel safe • Assurance • competence • courtesy • credibility • security • Empathy • easy access • good communication • customer understanding • personalised attention • Tangibles • physical evidence They listen to me People look smart
The gaps model of service quality • Where are things going wrong? • What leads to poor service quality • Gaps model of service quality • Refer to fig 4.8, p. 103, Reading 3.1 • Customer gap (Gap 5) • difference between customer’s expectations and perceptions of performance • Four provider gaps • each may lead to the customer gap
Consumer Past experience Personal needs Word-of-mouth communications Expected service GAP 5 Perceived service Service delivery (including pre- and post-contacts) External communications to consumers GAP 4 GAP 3 GAP 1 Translations of perceptions into service quality specifications GAP 2 Management perceptions of consumer expectations The Gaps Model of Service Quality Marketer
Customer expectations Reasons for Customer Gap 5 • Not knowing what customers expect • Not selecting the right service standards and designs • Not delivering to service standards • Not matching performance to promised Customer perceptions
Inadequate marketing research orientation Lack of upward communication Insufficient relationship focus Inadequate service recovery Reasons for provider gap I Customer’s expectations Company’s perceptions of customer expectations
Poor service design Absence of customer-defined service standards Inappropriate physical evidence and servicescape Translation of perceptions into service quality specifications Reasons for provider gap 2 Management perceptions of customer expectations
Poor human resource policies Failure to match supply and demand Customer not fulfilling their roles Problems with service intermediaries Reasons for provider gap 3 Customer-driven service designs and standards Service delivery
Lack of integration of marketing communications Inadequate management of customer expectations Overpromising Inadequate horizontal communications External communications to consumers Reasons for provider gap 4 Service delivery
Closing the gaps • Refer to table 4.2, p. 104 • Gap 1: Learn what customers expect • Gap 2: Establish the right service quality standards • Gap 3: Ensure that service performance meets standards • Gap 4: Ensure that delivery matches promises
Closing gap 1: Learn what customers expect • Use research, complaint analysis, customer panels • Increase direct interactions between managers and customers • Improve upward communications • Act on information and insights listen to customers
Closing gap 2: Establish the right service quality standards • Top management commitment to providing service quality • Set, communicate, and reinforce customer-oriented service standards • Establish challenging and realistic service quality goals • Train managers to be service quality leaders • Be receptive to new ways to deliver service quality • Standardise repetitive tasks
Prioritise tasks • Gain employee acceptance of goals and priorities • Measure performance of service standards and provide regular feedback • Reward managers and employees for achievement of quality goals Service Quality Awards
Closing gap 3: Ensure that service performance meets standards Can I take your order? • Attract the best employees • Select the right employees • Develop and support employees • train employees • provide appropriate technology & equipment • encourage and build teamwork • empower employees • internal marketing
You are a Star Service Provider • Retain good employees • measure and reward service quality achievements • develop equitable and simple reward systems
Closing gap 4: Ensure that service delivery matches promises • Seek input from operations personnel on what can be done • ‘Reality’ advertising • real employees, real customers, real situations • Seek input from employees on advertising • Gain communications between sales, operations and customers • Internal marketing programs • Ensure consistent standards in multi-site operations
In advertising, focus on service characteristics that are important to customers • Manage customer’s expectations • What are realistic expectations? • Explain industry realities • Tiered service options • Offer different levels of service - user pays Why do we always have to wait?
Service Satisfaction Information System • Customer Complaints • Surveys • Employee Surveys • Focus Groups • ‘Mystery shopping’ research • Competitive market surveys - benchmark
Measuring Satisfaction • Qualitative Research • Understand key drivers / determinants • Questionnaire design • Data analysis • Service performance index (SPI) • Importance - performance analysis
Customer expectations Attributes Business processes (key drivers) Installed when promised etc. etc. Installation Quick response to enquiries Customer service Possess product knowledge CSR* takes ownership of problem Overall Satisfaction Always first understand customer’s needs Personalised service Use customer’s name Call quality Be friendly and courteous Be friendly and courteous Repairs Practise empathy Give customer your name Billing *CSR = Customer Service Representative Figure 4.11 The determinants (drivers) of satisfaction for telecommunications services
Attribute Internal service standards 95% of calls answered within 3 rings All mail enquiries processed within 1 working day Quick response to enquiries Number of monthly complaints about slow service In 95% of calls, CSR is capable of taking responsibility for outcome Less than 5% abandoned call rate Figure 4.12 Linking customer expectations to internal service standards
Figure 4.14 Scatter diagrams showing correlations between drivers and the impact of each driver on overall satisfaction High positive correlation r = + 0.71 Overall Satisfaction Customer service performance Low positive correlation r = + 0.31 Overall Satisfaction Performance on repairs
Table 4.3 Correlation coefficients between key drivers (business processes) and overall satisfaction Driver (business process) Correlation coefficient (r) Installation 0.19 Customer service 0.71 Call quality 0.62 Repairs 0.31 Billing 0.42
Table 4.4 Estimated multiple regression model: example Y = 0.117+0.055X1+0.376X2+0.331X3+0.173X4+0.169X5 where: Y = Overall satisfaction X1 = Installation X2 = Customer service X3 = Call quality X4 = Repairs X5 = Billing
Figure 4.15 Importance-performance matrix High importance Focus improvement efforts here Maintain performance X 2 X 3 X 5 Low performance High performance X 4 X 1 Medium-low priority Reduce emphasis Low importance Legend: X1 Installation; X2 Customer Service;X3 Call quality; X4 Repairs; X5 Billing
Summary • Customer satisfaction • definition • benefits • factors that influence customer satisfaction • the disconfirmation of expectations model • four types of expectations • zone of indifference
Summary • ServQual - five dimensions of service quality • reliability, responsiveness, assurance, empathy and tangibles • Gaps model of service quality • Reasons for the gaps • Closing the gaps • Measuring customer satisfaction & service quality
Tutorial • Case 14 –Chiva Som p. 523 • Review questions 7, 8, 9 & 10