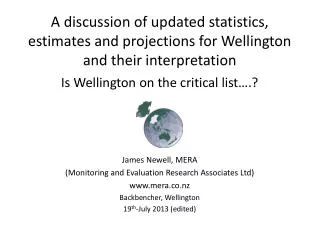
Statistics and their Interpretation;
Statistics and their Interpretation; Introduction QEP Guidelines Links and Resources Conclusion Lesson Plan Assignment Introduction Maritime accidents have been occurring for centuries.

Statistics and their Interpretation;
E N D
Presentation Transcript
Statistics and their Interpretation; Introduction QEP Guidelines Links and Resources Conclusion Lesson Plan Assignment
Introduction Maritime accidents have been occurring for centuries. But who do you think has the highest rate of survival between men, women, children and crew members? Introduction QEP Guidelines Links and Resources Conclusion Lesson Plan Assignment
First Scenario Empress of Ireland Early morning, May 29, 1914: The Empress of Ireland collides with another boat. 15 minutes after the collision, she sinks to the bottom of the St-Lawrence River. Introduction QEP Guidelines Links and Resources Conclusion Lesson Plan Assignment
Statistics for the Empress of Ireland Introduction QEP Guidelines Links and Resources Conclusion Lesson Plan Assignment
Second Scenario Titanic At 11:40 PM, the Titanic Struck an iceberg. Although the watertight doors were closed, it sank about three hours later. Introduction QEP Guidelines Links and Resources Conclusion Lesson Plan Assignment
Statistics for Titanic Introduction QEP Guidelines Links and Resources Conclusion Lesson Plan Assignment
Comparing Graphs of Both Tragedies Introduction QEP Guidelines Links and Resources Conclusion Lesson Plan Assignment
The Lesson Plan Students will learn to use statistics in the form of tables and graphs to interpret information on a particular event or population. Aim Introduction QEP Guidelines Links and Resources Conclusion Lesson Plan Assignment
Group Discussion • Groups of five: 10 minutes to discuss reasons for differing statistics • Information recorded on blackboard • Facts about both accidents given • 5 minutes to discuss in groups • Additional information added on board Introduction QEP Guidelines Links and Resources Conclusion Lesson Plan Assignment
Alternative Class Discussion • Class discussion on differing statistics • Teacher asks key questions • Information recorded on the board by students • Facts about both accidents given • 5 minutes to further discuss • Additional information added on board Introduction QEP Guidelines Links and Resources Conclusion Lesson Plan Assignment
For Both Types of Discussion Wrap-up of what was learned and how it can be used to gain information will follow. Questions designed to make them think a little further are asked. Example: What other categories could the passengers and crew be separated in? Introduction QEP Guidelines Links and Resources Conclusion Lesson Plan Assignment
QEP Guidelines According to the QEP, students should be able to organize and choose certain tools to present data: Construct tables Construct bar graphs, broken-line graphs and circle graphs Highlight some of the information that can be derived from a table or a graph Introduction QEP Guidelines Links and Resources Conclusion Lesson Plan Assignment
Cross-Curricular Intellectual Competencies Uses information Solves problems Exercises critical judgment Introduction QEP Guidelines Links and Resources Conclusion Lesson Plan Assignment
Assignment • An assignment on statistics from Census Canada • Compares % of working population for both genders • Designed to make them think about possible explanations for statistics Introduction QEP Guidelines Links and Resources Conclusion Lesson Plan Assignment
Sample Assignment Questions Fill in this table Use the information in the table to build a graph of your choice. Choose the kind of graph which you think will be most useful to interpret the data and explain your choice. Introduction QEP Guidelines Links and Resources Conclusion Lesson Plan Assignment
Assignment Questions What is the general tendency when comparing percentages from 1980 to 1995? How do these differ or compare? What do you think could explain this result? What do you think will be the tendency for these percentages for the year 2005 ? Introduction QEP Guidelines Links and Resources Conclusion Lesson Plan Assignment
Links and Resources The Lesson Plan on Statistics The Assignment The Assignment Correction Quebec Education Program Titanic Link Musée de la Mer (Empress of Ireland) Statistics Canada Introduction QEP Guidelines Links and Resources Conclusion Lesson Plan Assignment
In Conclusion By Francois Girardin and Jason Chen Introduction QEP Guidelines Links and Resources Conclusion Lesson Plan Assignment