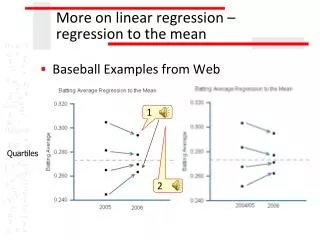
More Linear Regression
More Linear Regression. Outliers, Influential Points, and Confidence Interval Construction. Introduction. The following tutorial will show you how to: Make a scatterplot with confidence bands Find outliers and influential points in a data set

More Linear Regression
E N D
Presentation Transcript
More Linear Regression Outliers, Influential Points, and Confidence Interval Construction
Introduction The following tutorial will show you how to: • Make a scatterplot with confidence bands • Find outliers and influential points in a data set • Conduct multiple linear regression, including an interaction term • Calculate confidence intervals for parameter estimates, as well as individual and mean prediction
Consider the following data set: The file infant.txt contains data on the net food supply (# calories per person per day) and the infant mortality rate (# of infant deaths per 1000 live births) for 22 countries before World War II. Copy and paste the data into SAS using the following lines: http://www.biostat.umn.edu/~susant/PH6415DATA/infant.txt DATA infant; INPUT country $ food mortality; DATALINES; [paste data lines here] ;
Plotting Confidence Bands We want to determine whether there is a relationship between infant mortality and country’s net food supply. We also want to construct confidence bands around our regression line to visually predict mortality rates given a certain level of food supply.
SAS Code for Confidence Bands Type the following code into SAS. This is similar to previous regression analyses you have conducted, but two options have been added. “pred” requests the confidence bands for individual prediction, and “conf” requests the confidence bands for mean prediction levels.
Interpreting the Plot • “PRED” is the regression line • “U95M” is the Upper 95% Confidence Interval for mean prediction • “L95M” is the Lower 95% Confidence Interval for mean prediction • “U95” is the Upper 95% Confidence Band for individual prediction • “L95” is the Lower 95% Confidence Band for individual prediction Notice that the individual prediction bands are wider than the mean prediction bands.
Now that you have eye-balled the prediction levels, there is a formal way to calculate mean and individual prediction for a certain level of x (food). Suppose you wanted to know the mean and individual prediciton mortality rates for a country with a net food supply of 2900 calories. There is a simple way to calculate this in SAS. Add another line of data at the end of your data set with a made-up country name, 2900 and ‘.’ for the mortality value. Remember, SAS sees periods (.) as missing data. It will not take the missing value into consideration when calculating the regression line, but it will calculate prediction CIs for this value.
SAS Code: Add a new line of data to the datalines: … Uraguay 2380 94.1 Country 2900 . ; Re-run the data set, so that “Country” has been added to your data set, then type the following code into SAS: PROC REG DATA = infant; MODEL mortality = food / clb clm cli; RUN;
Explanation of SAS Code • “clb” requests the 95% confidence intervals for the parameter (β) estimates • “clm” requests the 95% confidence interval for mean prediction • “cli” requests the 95% confidence interval for individual prediction
Interpreting Output • The Regression Line is: Yhat = 311.45 – 0.08(food) • The 95% CI for β1is [-0.11,-0.05] Notice that the CI for β1does not contain 0, indicating that we reject Ho: β1= 0. There is a linear relationship between food and infant mortality. The same conclusion is reached by looking at the p-value for the test statistic (t* = -5.68, p-value < 0.0001).
Interpreting the CI Output Notice that a new line has been added to your output (Observation #23). This is the new country you added with a calorie amount of 2900. The Yhat (Predicted Value) for this calorie is 78.43, which you could also calculate from the regression line: Yhat = 311.45 – 0.08(2900). • The 95% CI for mean/average prediction is found under “95% CL Mean”: [62.12,94.74] • The 95% CI for individual/single prediction is found under “95% CL Predict”: [2.81,154.05] Notice that the CI for individual prediction is much wider than that of mean prediction.
Outliers and Influential Points To determine whether your data set contains any outliers or points that are influencing your model, use the options “r” to request residuals and “influence” to request measures of influence in your SAS output: PROCREG DATA = infant; MODEL mortality = food / r influence; RUN; QUIT;
Interpreting Output • To determine if a point is an outlier, look for a Student Residual with an absolute value greater than 2.6. Observation #7 (Chile) is an outlier, and observation #16 (Japan) is close to being an outlier. • To determine if a point is influential, look for a Cook’s D value greater than 1. There appears to be no influential points.