Download
1 / 13
130 likes | 135 Vues
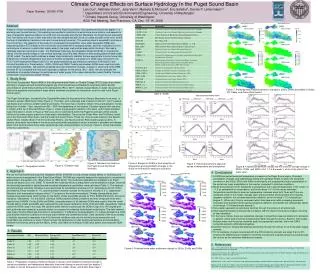
This study examines the impact of climate change and emission changes on the distribution of surface sulfate wet deposition in 2030. It compares different emission scenarios and their effects on sulfur deposition. Results show decreases in sulfate wet deposition in some regions and increases in others, highlighting the importance of addressing these factors in order to mitigate negative effects on ecosystems and human health.

E N D
The Effects of Climate and Emission Changes on Surface Sulfate Wet Deposition in 2030 Konrad Cunningham, Joel Arberman, Nadine Bell, Susan Harder, Drew Schindell, Gavin Schmidt
Topics • Climate Experiments • Sulfates • Sulfate Deposition • Objectives • Model Description • Conclusions • Ongoing Work
Sulfate Aerosol In The Environment • Sulfate deposition leads to acid rain • Affects of acid rain can have negative affects on ecosystems and human health • Sulfate aerosols can influence climate change
Sources of Emissions • Natural Sources of sulfates Volcanoes Oceans • Anthropogenic Sources (3/4 of tropospheric sulfate burden) • Sulfates(SO4-2) are formed through several mechanisms from the precursor primary pollutant sulfur dioxide (SO2 ) SO2 + H2O2 SO4-2 (occurs rapidly in clouds) OH + SO2 SO4-2 (gas-phase slow reaction forms new particles )
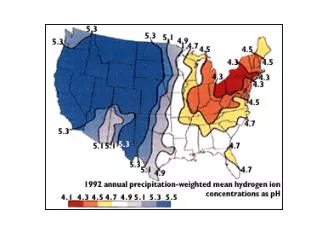
What is Wet Deposition of Sulfate? • Wet deposition is the process which forms acid rain • Occurs when clouds containing sulfate aerosols precipitates as rain • It can be formed in rain, fog and snow • Wet deposition is 40-80% of total deposition
Objectives • The study attempts to answer two questions • Do future changes in physical climate affect sulfur deposition? • Comparisons of resent day (1995) and future (2030) climate conditions and its effect on changes in distributions of wet sulfate deposition • How will changes in future emissions (from fossil fuel burning) affect sulfur deposition? • Comparisons of A1B and B1 scenarios under future climate conditions to the control 1995 data set
Model Description • Models are used for forecasting atmospheric composition and climate conditions • The model used is Model III which tracks 23 layers of the atmosphere • It consist of grid boxes that are 4ox5o • Model III incorporates the chemistry and physics of each grid box and calculates the fluxes between them • Boundary conditions from sea surface and sea ice temperature (these measurements came from another model) • The models can show climate change and the effect the distribution of pollutants • Models can also show the impact of different emission scenarios
Future Scenarios The study compares two future emissions scenarios devised by the IPCC • B1 Optimistic Scenario • Rapid economic growth • Rapid population growth (2050 population peaks) • Reductions in material intensity, and the introduction of clean and resource-efficient technologies • A1B Pessimistic Scenario • Rapid economic growth • Rapid population growth (2050 population peaks) • Balance between fossil fuels and other energy sources • http://www.chooseclimate.org/jcm24dec02/doc/emit/sres.html
1995 Control Chart • Sulfate wet deposition • PD control = 26 Tg S / yearEastern 2/3 of USA and Western Europe show similar rates of sulfate deposition between .9 – 3.6 (10-11 kg/m2/s) • Highest rates of deposition are seen over southern India, SE Asia, particularly eastern China with values ranging as high as 4.5 – 7 (10-11 kg/m2/s)
Impact of Climate Change on Sulfate Wet Deposition Using the A1B Scenario • Most regions climate change has negligible impact • India shows reductions of ~20% • Europe appears unchanged • Parts of SE Asia show ~30% increase in wet deposition in the 2030 Climate 2030 Climate - 1995 Climate
Effects of Climate and Emissions on Deposition 2030 A1B – 1995 Control A1B Scenario A1B 2030 climate + emissions = 37 Tg S / year Europe shows no net change USA shows moderate reductions in SO4-2 deposition India and SE Asia show moderate to high increases B1 Scenario B1 2030 climate+emissions = 27 Tg S /year Europe and the USA show a range of decrease in acid deposition of ~5-40% Eastern China shows similar reductions India continues to show increases 2030 B1 – 1995 Control
Conclusions • The Effects of “Climate Only” study • Showed no impact on distribution of sulfate deposition across Europe and USA • Climate change produced decreases in sulfate wet deposition in India (~30%), • Effects of Climate and Emissions study • Combined effects of emissions and climate changes relative to the 95 Control, showed • Decreases in sulfate wet deposition in USA for the pessimistic (A1B) scenario • Developing regions like India, Bangladesh, and SE China showed moderate to high increases of ~30-50% in acid deposition • The effects of climate and emission changes for the B1 scenario showed: • A broad trend in the NH of decreasing wet deposition, in contrast to the SH which shows the opposite trend. • Compared to the A1B scenario, greater areas of USA, Western Europe and Eastern China show broad decreases in acid deposition
Work in Progress Future studies include impacts of climate change on surface concentrations of other aerosol pollutants: • Dry Deposition of Sulfates SO4-2 • Surface level O3 • PAN • CO The concentrations and distributions of these pollutants will be also be forecasted for 2030 using the A1B and B1 scenarios and the 1995 and 2030 data sets