Analytical Example Using NHIS Data Files
Analytical Example Using NHIS Data Files John R. Pleis Research Question Is the type of health insurance coverage held by adults > 65 years of age associated with flu shot use? Additional Covariates Race/ethnicity Region of residence Education, marital status, sex Smoking

Analytical Example Using NHIS Data Files
E N D
Presentation Transcript
Analytical Example Using NHIS Data Files John R. Pleis
Research Question Is the type of health insurance coverage held by adults > 65 years of age associated with flu shot use?
Additional Covariates • Race/ethnicity • Region of residence • Education, marital status, sex • Smoking • Number of physician office visits
Additional Covariates • Regular place of health care • Selected chronic conditions • diabetes, respiratory difficulties, or heart disease • Low-income program participation
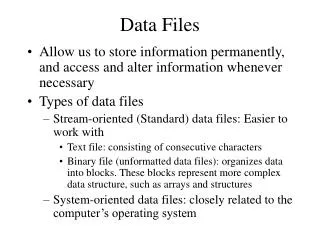
Data Files • Determine which data files are needed for the analysis • A good source for determining the file content is the Survey • Description document:http://www.cdc.gov/nchs/nhis.htm
Data Files • This analysis will utilize data from several files, which include: • Person • Sample adult • Family
Person File • Each person record also has a sampling weight • Used to inflate each observation • Adjusted for non-response as well as U.S. Census population totals by age, sex, and race/ethnicity
Person File • Sum of the weights = Size of the Civilian Non-Institutionalized Population • For more information regarding weights and other design issues, please attend: Practical Applications in Design and Analysis of Complex Sample Surveys (Session # 30)
Sample Adult File • Each sample adult record has a sampling weight • Different from the person sampling weight • Sum of the weights = Size of the Civilian Non-Institutionalized Population of adults > 18 years of age
Sampling Weights • Each data file has its own sampling weights • Weights should be used, if not: • Totals, means, and proportions are affected • Estimates such as regression coefficients are biased
2000: Race/ethnicity (%)Sample Adults (aged > 65) Source: 2000 NHIS
Sample Design • The NHIS has a complex sample design • The sample design affects the computation of variance of estimates • A complex sample will produce larger variances than a Simple Random Sample (SRS)
Sample Design • Compared to a SRS, confidence intervals are wider, and statistical significance is harder to achieve for complex survey data • If variance estimates are needed, the complex sample design should be accounted for in the analysis
NHW vs. NHB Men Aged < 65: Bed Days Source: 2000 NHIS
Research Question Is the type of health insurance coverage held by adults > 65 years of age associated with flu shot use?
Additional Covariates • Race/ethnicity • Region of residence • Education, marital status, sex • Smoking • Number of physician office visits
Additional Covariates • Regular place of health care • One place that the adult usually went to when either sick care or preventive health care was needed • Does not include emergency rooms (< 0.5% of the sample)
Additional Covariates • Respiratory difficulties • Asthma (EVER) • Chronic Obstructive Pulmonary Disease (COPD)
Additional Covariates • Heart disease (EVER) • Coronary heart disease • Angina pectoris • Heart attack • Any other heart condition
Additional Covariates • Low-income programs • Supplemental Security Income • Temporary Assistance for Needy Families (TANF) • Food stamps • Governmental rental assistance
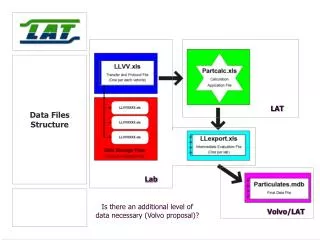
Creating the File • Not all the variables of interest for this analysis are contained in one file • The Person, Sample Adult, and Family files can be merged to create one data file
Creating the File • Person file • Health insurance • Race/ethnicity (all) • Governmental rental assistance (last 12 months)
Creating the File • Sample Adult file • Flu shot use (last 12 months) • Race/ethnicity (partial) • Smoking, chronic conditions • Number of physician office visits (last 12 months)
Creating the File • Sample Adult file • Sample Adult weight
Creating the File • Family file • Any family member received any of the following in the past 12 months: • Supplemental Security Income • TANF • Food stamps
Creating the File • Person and Sample Adult files • Education, marital status, sex • All files • Region of residence • STRATUM/PSU (design info for correct variance estimates)
Data available at the NHIS URL: http://www.cdc.gov/nchs/nhis.htm SAS and SPSS programs are also available to create datasets from the provided data Creating the File
Creating the File • Merge the Person, Sample Adult, and Family files together to create one data file • Needed to merge files to analyze the association between health insurance coverage and flu shot use
Creating the File • Each person and each family has a unique identifier (ID) in the NHIS • These IDs are used to merge the data sets together
Creating the File • Person-level ID • Created from household number • (HHX) and person number (PX) • Family-level ID • Created from household number • (HHX) and family number (FMX)
Creating the File Person file Sample Adult file = New file Family file = Adults aged < 65, non-Sample Adults aged > 65, and all children
Creating the File • Why not drop the records for all children, all Adults aged < 65, and all adults aged > 65 who were non-Sample Adults? • Depending on the situation, this could alter the variance estimates
Creating the File • Important to retain the file with all the observations and target the analysis to the particular domain of interest • Several software packages for analyzing survey data (such as SUDAAN and STATA) have this capability
Analysis • Crosstabs of flu shot propensity among adults > 65 years of age • Multiple logistic regression • Data from the NHIS 2000 public use files
Subpopulation Analyzed • 6,180 Sample Adults > 65 years of age • Representing a population of 32.7 million
Analysis • 89 adults > 65 years of age (1%) did not provide their flu shot status and were excluded from the analysis
Flu Shot Rates By Health Insurance (aged > 65) Medicaid and Medicare 54% Medicare 58% Medicare and Private 69% Medicare and other 72%
Flu Shot Rates By Race/ethnicity (aged > 65) Non-Hispanic black 48% Hispanic 56% Non-Hispanic other 62% Non-Hispanic white 67%
Flu Shot Rates By Education (aged > 65) < High School 58% High school/GED 65% Some college 66% A.A. degree 66% Bachelor’s degree + 74%
Flu Shot RatesBy Regular Place of Health Care (aged > 65) Yes 65% No 25%
None 38% 1 visit 60% 2-3 visits 61% 4-5 visits 67% 6-7 visits 69% 8-9 visits 72% 10-12 visits 73% 13-15 visits 74% 16+ visits 75% Flu Shot RatesBy No. of Physician Office Visits, Last Year (aged > 65)
Odds Ratio (OR) From Logistic Regression dependent variable = flu shot in last 12 months p<0.05
Odds Ratio (OR) From Logistic Regression dependent variable = flu shot in last 12 months p<0.05
Odds Ratio (OR) From Logistic Regression dependent variable = flu shot in last 12 months p<0.05
Odds Ratio (OR) From Logistic Regression dependent variable = flu shot in last 12 months p<0.05
Odds Ratio (OR) From Logistic Regression dependent variable = flu shot in last 12 months p<0.05
Odds Ratio (OR) From Logistic Regression dependent variable = flu shot in last 12 months p<0.05
Odds Ratio (OR) From Logistic Regression dependent variable = flu shot in last 12 months p<0.05
Odds Ratio (OR) From Logistic Regression dependent variable = flu shot in last 12 months p<0.05
Odds Ratio (OR) From Logistic Regression dependent variable = flu shot in last 12 months p<0.05