Download
1 / 1
10 likes | 251 Vues
The Lagrangian model

E N D
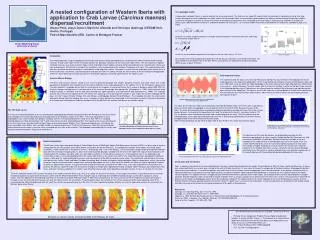
The Lagrangian model A Lagrangian submodel (floats) is used to simulate the larvae movements. The floats use the model 3D velocity fields for advection in a predictor-corrector timestep. Recent developments were introduced in the floats code at UCLA to enable floats to travel between grids (between the different communicating through Agrif models). To increase the degree of realism of Larvae movements three additional components were introduced to the float model; i) A deterministic migration to simulate the diurnal cycle (-60m/h between 4 and 6 a.m. and 60m/h between 10 and 12 p.m. ; ii) A vertical random fluctuation associated with the turbulence submodel (Large, et al., 1994): where is a uniform random number [0 1]. And Kt turbulent model the vertical heat difusivity; and finally; iii) A horizontal random walku’ Float distribution at two simulation times (before and during the upwelling pulse) Arrows indicate the wind stress with red arrows corresponding to 0.1 Pa. 1000, 200 ans 100 isobaths are represented. Horizontal distribution (occurence of floats per gid point smoothed with a 3 point box-car filter) corresponding to different floats release times (Zoeaea stages) for 8 of April (model time) Ocean Modelling Group University of Aveiro Introduction: A nested configuration using climatologically initialisation and forcing is being developed for the simulation of the Western Iberia offshore spring transition. A large-scale model (16 km resolution) provides the boundary conditions for the mesoscale model (5 km). The most significant regional circulation features (e.g., Azores Current, Slope Current and Slope Current eddies and early filament development) are simulated after a three year spin up experiment. A third level of nesting (2 km resolution) is also implemented for the northern Portuguese shelf zone. The model includes tides, and river runoff and the local circulation is simulated with a high degree of realism. The model is used to simulate a complete cycle (March-June) of Green Crab larvae recruitment. Lagrangian particles and passive tracer are used to simulate the main features of the larvae dispersal/aggregation and fluxes. Some behaviour characteristics like the vertical deil-migrations are being implemented in the model as well. Carcinus MaenasBiology: The green crab Carcinus maenas stands as the most characteristic decapods that inhabits European estuaries and rocky shores with a wide geographical distribution from Scandinavian Peninsula to Gibraltar strait. Large populations of the species exist in the Portuguese coastal area. The most important is probably the one from the ria de Aveiro, as it supports a commercial fishery that is unique in European waters (500 1000 t/y). Carcinus maenas hatching occurs in the lower parts of the estuaries during night-time ebbing tides (Queiroga et al., 1994). Newly hatched larvae migrate vertically in synchrony with the tidal cycle attaining their higher position in the water column ebb (Queiroga et al., 1996). This migration ensures that all larvae are exported to the sea shortly after spawning. Larvae development includes 4 zoel stages (Z) and one megalopa (ZI 0-8 days; ZII- after 9 days; ZIII-after 22 days; ZIV- after 30 days and Megalopa between 35 and 50 days). The megalopa reinvades the estuary more abundantly during night-time flooding tides when it occupies a higher position then during ebb. In the Portuguese estuaries maxima of abundance of first zoea were found between February and April, and in Ria de Aveiro the maxima Recruitment was found in spring. where lis the unresolved subgridscale (here taken as the cell size) and = 10-7 m2/s3. An example of the vertical displacment obtained in the firts days of simulation is presented in the figure. The floats spend near the bottom most of the time. When surfacing they are subjected to random fluctuations Within a layer of about 10 meters. Horizontal distribution of Carcinus maenas (Zoe I, III and Megalopa) in April 1991.Adapted from Queiroga et al. (1996). Simulated tidal elevation near Ria de Aveiro and indication of of float realese times (blak arrows) Vertical migration of a set of floats in the first days of simulation Environment and Sea Research Unit (CEsAM) /University of Aveiro • Portugal-France Cooperation Program Pessoa-Egide (collaboration between U. Aveiro and IRD France.) – ‘’Development of a Coastal Ocean Model with Grid Refinement for Western Iberia and its Application to the Study of Local Larvae Retention Rrocesses’’. • FCT- Project ProRecruit POCTI/BSE/36663/99 • FCT- CEsAM –Funding program. Evolution of surface velocity and salinity fields from February 20to 26. Carcinus maenas Megalopa A nested configuration of Western Iberia with application to Crab Larvae (Carcinus maenas) dispersal/recruitment Álvaro Peliz, Jesus Dubert, Martinho Almeida and Henrique Queiroga (CESAM/Univ. Aveiro, Portugal) Patrick Marchesiello (IRD, Centre of Bretagne France) Float experiment setup: The experiment with the floats starts from mid-February to mid-April. As was refered in the introduction the larvae hatching occurs in the night-time ebbing tides. For the study period and aiming to simulate the distributions observed in the 1991 April cruise we define the model Megalopa as the floats released in the nigth-ebb about one month before the survey (i.e., end of February). The other stages (Zoe 3-4, Zoe 2-3, and Zoe 1) will be as the floats to be released in the following ebb tide events. Float clusters are released near the mouth of Ria de Aveiro at mid-nigth during four days centered in the ebb period. The figure on the left side shows the a tidal prediction for Ria de Aveiro coastal zone with the indication of release of floats (black arrows). Note that the last realese covers the observation period an corresponds to Zoe 1. The figure on the right side shows two instantaneous total float distribution maps. On the left side it is possible to observe that the floats are aggregate in several patches mainly to the north of the Ria and very close to the coast. The more offshore patch shows a meridional elongation possibly associated with shear flow in the surface buoyant plumes. In the peak of the upwelling event, (note the arrows on the top left - red arrows stand for 0.1 Pa), the patches move southward and inshore and a large group go to the coast. Only the southern tip of the elongated patch seems to be advected offshore but this one is clearly being advected by the filament structure being generated in the northern bound of Aveiro Canyon. (Note the flow distribution for day 25-26 at about 40.5 N and –9.2W in the surface flow evolution figure) The 1991 April survey: A survey of the spatial distribution of the larvae along with hydrological observations was preformed off the Portuguese coast in the frame of a campaign of the Eastern Boundary Currents programme of the WOCE II (Hagen et al, 1994). The survey compromise a set of hydrological cross-shore sections with plankton sampling over the shelf conducted between 2 and 10 of April 1991. The sampling method allowed a vertical discretization in 30 m wide strata. No larvae were collected below 90m. The majority of the larvae concentrated in the first strata. Also it was observed that older stages tend to move deeper 30-60m. The C. Maenas distribution was restricted to the inner and middle shelf stations with a variable number of maxima along a line of 15-20 km from the coast. Older Zoea were distributed further offshore and first zoea is closer to shore associated with the inlets of the estuaries. The Megalopa collected during this survey were hatched somewhere between February 10 and March 3. The figure on the left shows distributions are produced by counting the float occurrence per grid point in a given moment (model day April 8). Afterwards this field was boxcar filtered with a 3 point box. No observations are available so far for a validation of the model currents. A considerable source of error may be in the very smooth NCEP wind fields, and in the some what adHoc imposed river flow (taken from nearby averaged station data). In what concerns the larvae itself it sould be noted that it can originate from other sources, namely the not very distant Mondego and Douro rivers. Having this in mind we attempt only a very qualitative comparison of the float distribution with the plankton distributions obtained with cruise data. Nested configuration The 3D free-surface sigma-coordinate Regional Ocean Model System (ROMS) with Adptive Grid Refinement in Fortran (AGRIF) has been used to create a configuration for the mid latitude Eastern North Atlantic centered on the Iberian Peninsula. The configuration includes three models with varing spatial resolutions (~16km visible area in the figure on the left; ~ 6k white box and ~2 km small red box). The nesting (Agrif) bridges large coverage low resolution grids with the small high resolution grids in a way that the former provide boundary conditions for the later at the model time step. Vertical resolution is the same between the 3 models. 30 sigma levels are used. Sigma resolution is increased near surface (s = 7) ensuring that even in the deep ocean the surface Ekman layer is resolved (spacing between the surface sigma levels is less than a few meters). The experiment has been developed in 3 different stages: i) Spin up of the Large grid during three years (with convergence of the EKE to stationary mean value). The initialization and forcing for this stage were base on the Levitus, Coads and Topex Poseidon climatology data, to obtain initialization and climatological fields for temperature, salinity, sea surface elevation, heat,mass and momentum surface fluxes and mean geostrophic currents. Ii) Spin up of the medium size (6km res.) grid in a period of 3 months to achieve a typical winter situation. iii) Experiment with all grids aiming to the simulation of the 1991 event. In this later experiment the initialisation was given by the previous experiments but with atmospheric forcing for the target dates obtained from daily averaged NCEP reanalysis data (momentum, heat fluxes and solar shortwave radiation). The model is also forced by tidal elevation at the boundaries and point sources of mass, to simulate the river flow. Disscussion and conclusions Zoe 1 is obviously the closest to the observed field once it has only started to be introduced in the model. The distribution for Zoe3-4 shows significant differences. It shows only a significant patch (a very small one is visible to the north of Ria de Aveiro) but it is very close to the coast in comparison to the observed ones. Megalopa distribution is closer to the measured ones. It has different patches north and south of Ria and shows a more homogeneous cross-shore distribution. In our opinion, considering that no significant differences exist between real and model currents, the disparity between model and observed distributions is related to the miss-representation of the model vertical migration. The adopted scheme is exaggerating the retention effect which is possibly true in older stages. Data indicate that the vertical migration pattern changes along the Zoea development. Older larvae tend to migrate to deeper levels as long as younger larvae spend more time close to the surface. These could have explained the difference in the Zoe3-4 and Megalopa (closer to the observed data). Along with the improvement in the vertical migration of the larvae distributing the sources of larvae between different estuaries possibly improves the results. Finally, The patch size is sensitive to the initialisation. In nature the dynamics associated with river outflow should contribute to increase the horizontal mixing and enlargement of the patch at the beginning. References Queiroga, et al ,Mar Ecol Prog. Ser, 111:63-72, 1994 Queiroga, H. J. Plankton Research,18,nº 11,1981-2000, Hagen et al, 1994, Berichte des Bundessamtes fur Seeschiffahrt und Hidrographie, Nr 2,hamburg-Rostock Peliz et al, 2003, J. Geophys. Res 108(C8), 3268, doi: 10.1029/2002JC001443 Large et al, Rev. Geophys., 32, 363–403, 1994. The most important features of the surface circulation in the region of western Iberia (e.g., Peliz et al., 2003) are present in the results. On the large scale context it is possible to observe the main meridional gradients associated with the Azores Current and the Western Iberia Winter Front. Along the coasts (especially north of 38N) the poleward slope current warm signatue is clearly visible. The main objective of the modelling experiment is simulate the period of February to April of 1991which corresponds to the necessary time for the development of crab larvae cought in the April survey. The local circulation features are also well represented in the simulations. The plate bellow shows the evolution of the surface salinity during the major upwelling event of the simulationperiod. Note that before and after the event the currents are generally weak over the shelf. The most important circulation features are over the slope zone and over the innershelf (the Western Iberia winter Plume).