
Abstract
Exploring the Use of Plasmids in DNA Microarray Technology B. Daniel Pierce and A. Malcolm Campbell Biology Department, Davidson College, Davidson, NC 28035. 1:1 Probe Ratio Results . Abstract. Chip Design and Sample Scans.

Abstract
E N D
Presentation Transcript
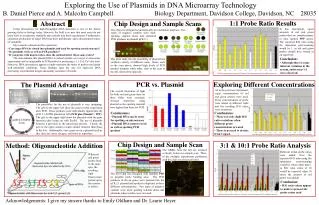
Exploring the Use of Plasmids in DNA Microarray Technology B. Daniel Pierce and A. Malcolm Campbell Biology Department, Davidson College, Davidson, NC 28035 1:1 Probe Ratio Results Abstract Chip Design and Sample Scans • Using microarrays for high-throughput DNA detection is one of the fastest growing fields in biology today. However, the field is so new that most users do not know how to incorporate standards and controls into their experiments. Furthermore, consistent production of target DNA has been problematic and a documented source of variability. • My research centered on three questions: • Can target DNA be cloned into plasmids and used for spotting on microarrays? • Do plasmids work as well as PCR products? • If you probe with known ratios, does the method detect those same ratios? • The data indicate that plasmid DNA is indeed useable as a target in microarray experiments and is comparable to PCR product at producing a 1:1 Cy5:Cy3 dye ratio. However, DNA microarrays appear to under-represent the ratios of probes used under well-controlled conditions. These findings open the way for improved DNA microarray experimental design and quality assurance of results. In this experiment, equal amounts of red and green probes that are complementary to nine spotted PPP genes. The expected R/G ratio using the intensities post-scanning would be 1, as red and green probes should have bound at an equal rate. The chip was designed asymmetrically for orientation purposes. Two types of negative controls were used: spotting solution alone and unrelated PCR products in plasmid pCR 2.1. • Conclusion: • Although there is some inherent variation in the system, ratios near 1:1 were observed. This pilot study into the possibility of plasmid use yielded a variety of different scans. Some, such as the scan above, showed high levels of PCR product intensity while other, such as the scan to the left, showed the opposite. Each bar represents the average of 1408 spots. Error bars represent 95% confidence intervals. PCR vs. Plasmid Exploring Different Concentrations The Plasmid Advantage As in the previous experiment, equal concentrations of red and green probes were used. Three concentrations of probe were added in different trials and the resulting R/G ratios were examined. The overall intensities of light for both red and green dyes on three slides were averaged. Average intensities using plasmid as the spotting material were higher than those for PCR. Picture courtesy Emily Oldham The possibility for the use of plasmids is very intriguing. The gels to the upper left show the genes in this experiment after PCR. These products were individually ligated into the pCR 2.1-TOPO plasmid at left (PCR plus Plasmid = PPP). The gels to the upper right show the plasmids with the gene insertion after being cut with EcoRI. The use of plasmids bestows a precision to the microarray process. Clearly the gels to the right contain a much cleaner material than those to the left. Additionally, once genes are in a plasmid such as this, they are easier, cheaper, and faster to reproduce. Insertion Site • Conclusions: • Plasmid DNA can be used for spotting on microarrays • Plasmid DNA seems to work as well as spotting PCR product • Conclusions: • There are only slight R/G ratio variations when different probe concentrations are used • There is no need to deviate from 1 ng/µL www.invitrogen.com Each bar represents the average of 1408 spots. Error bars represent 95% confidence intervals. Chip Design and Sample Scan 3:1 & 10:1 Probe Ratio Analysis Method: Oligonucleotide Addition The GRIDs from the left are oriented vertically below in a sample scan. Three of the multiple experiments performed with this chip are presented below. Different initial probe ratios were added. Now the expected R/G ratio using the intensities post-scanning would be values other than 1 (a R/G ratio value of 10 would be expected when 10 times the amount of red probe was added). When red and green probes bind to the same spot, the resulting light fluorescence picked up by the scanner is yellow. The next chip was designed with multiple PPP as possible probe binding sites. The PCR products of eleven genes were inserted into the pCR 2.1 plasmid and spotted in duplicate in three different concentrations. Two types of negative controls were used: spotting solution alone and plasmids whose probes were not used. • Conclusion: • R/G ratio values appear to under represent the probe ratios used Each bar represents the average of 1408 spots. Error bars represent 95% confidence intervals. Acknowledgements: I give my sincere thanks to Emily Oldham and Dr. Laurie Heyer. Helping Students Discover Genomics, Proteomics & Bioinformatics A. Malcolm Campbell, Laurie J. Heyer, Adam Abele, Brian Akin, Danielle Choi, Parul Karnik, Peter Lowry, David Moskowitz, Emily Oldham, Jennifer Madden


