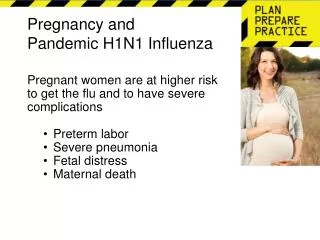
Human Mobility Network, Travel Restrictions and Global Spreading of H1N1 pandemic
Human Mobility Network, Travel Restrictions and Global Spreading of H1N1 pandemic. Contents. What is Human Mobility? Human Mobility behaves as a channel for the disease to spread GLEaM (Global Epidemic and Mobility Model). Human Mobility.

Human Mobility Network, Travel Restrictions and Global Spreading of H1N1 pandemic
E N D
Presentation Transcript
Human Mobility Network, Travel Restrictions and Global Spreading of H1N1 pandemic
Contents What is Human Mobility? Human Mobility behaves as a channel for the disease to spread GLEaM (Global Epidemic and Mobility Model)
Human Mobility • Mobility is moving from one place to the other for the sake of the convenience in life. • There can be many reasons few of them are: • Weather • Business • Travel • Natural Disasters
Every day millions of people travel across the world covering millions of mile in a day. As per the research 60 million people travel via air and covers billions of miles in one week. There are 3362 airports in 220 countries 16842 connections between them, which creates a large and very complex network.
Model includes all the airports, 3362, in 220 countries. All the population is divided into sub population. Each sub population is surrounding each air port. In the figure on right shows the homogeneous mixing of infection in the same area as well as in the different area. Areas are connected through air travels.
Background ¼ of the total population in Europe died because of the black death. 14th October,1492 Columbus landed with some European settlers and in that century more Americans died because of disease brought by them. European communities isolated from each other and in 1520, half of the Aztec population was succumbed to small pox. In 11th June,2009 World Health Organization (WHO) raised a pandemic alert of level 6. As of 19th July,2009 137,232 cases were registered across 142 countries.
Global Epidemic and Mobility Model (GLEaM) It is a structured meta-population model used for evolution of the pandemic Performs a maximum likelihood analysis of the parameters against the actual chronology of newly infected countries. This method is complex as it involves Monte Carlo generation. It is easy to estimate disease transmissibility as it has the accurate and early stage data of newly affected country.
Human Mobility Patterns Models based on high quality data helped to estimate disease transmissibility. It also helps to know what the seasonal affects are on the disease spreading.
Method Meta-population model is based on meta-population approach. Whole world is divided into geographical regions with a sub-population network. These subpopulations are interconnected with the transportation and human mobility. Time scale separation approach for the short range mobility between sub population defines the effectiveness of disease.
Model is made of three following layers: • Population: High resolution population database provided by the SociEconomic Data and Application center (SEDAC), which estimates the population • Mobility Layer: Data given by IATA and Official Airline Guide, which includes number of seats available and pairs of airlines connected by direct flights. • Epidemic Layer: This layer defines the disease and population dynamics.
Stochastic procedure is used to simulate the mobility of an individual. • An individual can be in one of the following state while sub population is affected by infection: • Susceptible • Latent • Infectious • Symptomatic • Asymptomatic • Permanent Recovered In the latent (incubation) period there is no secondary transmission occurred.
Spreading rate of a disease is depends on the reproduction number R0 R0 is the secondary cases produced by primary case. β is the infectious rate for the symptomatic person. Γββ is the infectious rate for the asymptomatic person. Average latency period is ε-1 Probability of entering into symptomatic compartment is 1-pa Probability of entering into symptomatic compartment is pa
Symptomatic infectious is further divided into two cases: • An individual who can travel with probability pt. • An individual who can not travel due to illness 1-pt • Infectious individual will recover with the rate of µ.
Compartmental structure in each sub population. Each individual can be in : susceptible, latent, infectious, symptomatic who cab travel, symptomatic infectious who can not travel due to illness, asymptomatic infectious and permanent recovered. Asymptomatic is less infectious than Symptomatic. Latent is the incubation period when no secondary transmission occur. All transitions are binomial or multinomial to preserve the discrete and stochastic nature of processes.
Global invasion of 2009H1N1 pandemic during the early stage of outbreak. Arrows represent seeding of infection from Mexico to unaffected country. Colors are to show different time seeding.
Travel Interventions Early stage of the outbreak many countries implemented a restriction on the air traffic. 40% of international air traffic reduction to/from Mexico. After international alert 14 entities started awareness programs. Stopping non essential travel to outbreak areas cause more decrease in air traffic.
Results Panels: A,B are the probability distribution of arrival time in UK and Germany respectively. Dotted vertical line shows the observed arrival time and solid vertical line shows starting date of travel restriction. Panels C,D are the cumulative travel distribution. In this any source of infection in seeding event is considered. As per the Computational approach all the detectable and non-detectable cases are taken into account.
Even after giving a 90% restriction in the air travel there was no big difference in arrival time of disease in any country. Measure of arrival time with different values of travel restrictions, which was not greater than 20 days. Even the greatest possible travel restriction has been applied at the starting phase, there was no big difference measured in arrival time of pandemic to other countries.
References ChiaraPolettoRecent Approaches in Modeling animal infectious diseases Christophe Fraser Pandemic Potential of a strain of Influenza A VittoriaColiza, Alain BarratModeling the worldwide Spread of Pandemic Influenza: Baseline case and Containment Interventions Paolo Bajardi, ChiarraPolettoHuman Mobility Networks, Travel Restrictions Global Spread of 2009 H1N1 pandemic Roxana Lopez-Cruz Structured SI Epidemic Models with Application to HIV Epidemic.