Download
1 / 21
280 likes | 1.28k Vues
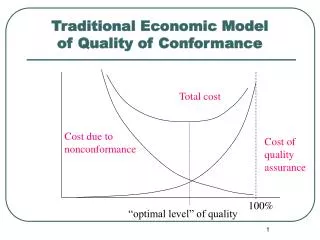
Traditional Economic Model of Quality of Conformance. Total cost. Cost due to nonconformance. Cost of quality assurance. 100%. “optimal level” of quality. Modern Economic Model of Quality of Conformance. Total cost. Cost due to nonconformance. Cost of quality assurance. 100%.

E N D
Traditional Economic Model of Quality of Conformance Total cost Cost due to nonconformance Cost of quality assurance 100% “optimal level” of quality
Modern Economic Model of Quality of Conformance Total cost Cost due to nonconformance Cost of quality assurance 100%
Problem Solving Process • Redefining and analyzing the problem • Generating ideas • Evaluating and selecting ideas 4. Implementing ideas
The Deming (Shewhart) Cycle Act Plan Study Do
PDSA Cycle (1 of 3) • PLAN • Select a Problem • Understand and analyze the present situation • Identify appropriate countermeasures
PDSA Cycle (2 of 3) • DO • Set the countermeasures in action (i.e., conduct a trial run) • STUDY • Study the effectiveness of countermeasures
PDSA Cycle(3 of 3) • ACT • Revise standard operating procedures • Train affected employees • Establish a plan for future actions
Ways to Improve A Process (1of 2) • Reducing handoffs • Combining or eliminating steps • Performing steps in parallel rather than in serial order • Using technology
Ways to Improve A Process (2 of 2) • Involving key people early • Creating more consistent inputs • Eliminating waste • Correcting inadequate measures or adding new measures to a process
Creative Problem Solving • Mess Finding – identify symptoms • Fact Finding – gather data; operational definitions • Problem Finding – find the root cause • Idea Finding – brainstorming • Solution Finding – evaluate ideas and proposals • Implementation – make the solution work
The Seven QC Tools • Flowchart • Run chart/Control chart • Check sheet • Pareto diagram • Histogram • Cause-and-effect diagram • Scatter diagram
Flowchart • Shows unexpected complexity, problem areas, redundancy, unnecessary loops, and where simplification may be possible • Compares and contrasts actual versus ideal flow of a process • Allows a team to reach agreement on process steps and identify activities that may impact performance • Serves as a training tool
Run Chart • Monitors performance of one or more processes over time to detect trends, shifts, or cycles • Allows a team to compare performance before and after implementation of a solution to measure its impact • Focuses attention on truly vital changes in the process * * * * * * *
Control Chart • Focuses attention on detecting and monitoring process variation over time • Distinguishes special from common causes of variation • Serves as a tool for on-going control • Provides a common language for discussion process performance * * * * * * *
Check Sheet • Creates easy-to-understand data • Builds, with each observation, a clearer picture of the facts • Forces agreement on the definition of each condition or event of interest • Makes patterns in the data become obvious quickly xx xxxxxx x
Pareto Diagram • Helps a team focus on causes that have the greatest impact • Displays the relative importance of problems in a simple visual format • Helps prevent “shifting the problem” where the solution removes some causes but worsens others
Histogram • Displays large amounts of data that are difficult to interpret in tabular form • Shows centering, variation, and shape • Illustrates the underlying distribution of the data • Provides useful information for predicting future performance • Helps to answer the question “Is the process capable of meeting requirements?
Cause and Effect Diagram • Enables a team to focus on the content of a problem, not on the history of the problem or differing personal interests of team members • Creates a snapshot of collective knowledge and consensus of a team; builds support for solutions • Focuses the team on causes, not symptoms Effect Cause
Scatter Diagram • Supplies the data to confirm a hypothesis that two variables are related • Provides both a visual and statistical means to test the strength of a relationship • Provides a good follow-up to cause and effect diagrams * * * * * *
Tools for Problem Solving Problem Solving Step Principal Tools Understanding the mess ……. Flowcharts, run charts, control charts Finding facts …………………. Check sheets Identifying problems ………... Pareto diagrams, histograms Generating ideas ……………. Cause and effect diagrams Developing solutions ……….. Scatter diagrams Implementation ……………... The 7 Management and Planning tools
Poka-Yoke (Mistake-Proofing) • An approach for mistake-proofing processes using automatic devices or methods to avoid simple human or machine error, such as forgetfulness, misunderstanding, errors in identification, lack of experience, absentmindedness, delays, or malfunctions