Download
1 / 18
190 likes | 709 Vues
Understand what comprises the Food Manufacturing/Processing Industry. Understand the changes occurring within this industry and the resultant implications. Specifically: Which food types receive the greatest value-added throughout the manufacturing process. Recent mergers / consolidation

E N D
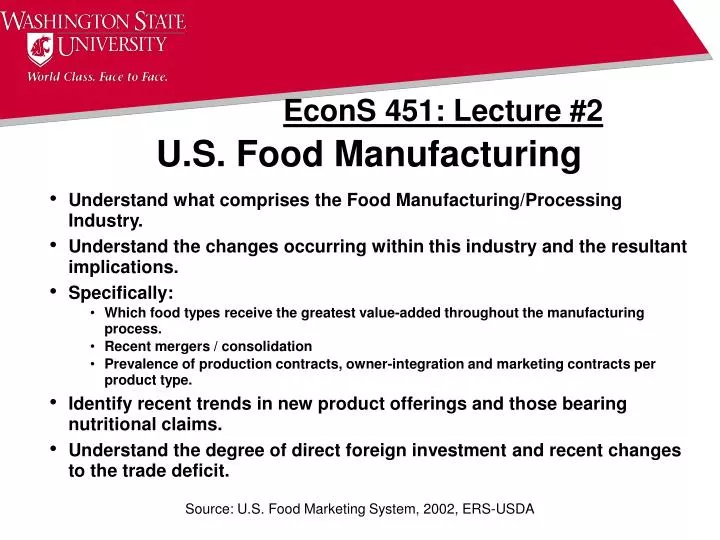
Understand what comprises the Food Manufacturing/Processing Industry. • Understand the changes occurring within this industry and the resultant implications. • Specifically: • Which food types receive the greatest value-added throughout the manufacturing process. • Recent mergers / consolidation • Prevalence of production contracts, owner-integration and marketing contracts per product type. • Identify recent trends in new product offerings and those bearing nutritional claims. • Understand the degree of direct foreign investment and recent changes to the trade deficit. U.S. Food Manufacturing EconS 451: Lecture #2 Source: U.S. Food Marketing System, 2002, ERS-USDA
U.S. Food Manufacturing /Processing Definition • All firms and establishments that manufacture or process foods or beverages for human consumption and • Other related products such as manufactured ice, chewing gum, vegetable and animal fats/oils and prepared feeds for animals and fowl. Source: U.S. Food Marketing System, 2002, ERS-USDA
A Value-Added Business Source: U.S. Food Marketing System, 2002, ERS-USDA
Nominal Value of Processed Food Shipments • Indication of a mature market Source: U.S. Food Marketing System, 2002, ERS-USDA
Value added = Shipment Value - Cost of Production Ratio of Value Added = 1-(Value Added / Shipment Value) Meat Dairy Fats / Oils Where the Value Added by Manufacturers Occurred Ratio of Value Added All < 30% http://www.ams.usda.gov/mnreports/nw_ls410.txt • Bakery Products • Beverages All > 60% Source: U.S. Food Marketing System, 2002, ERS-USDA
Unique Agriculture Attributes Source: U.S. Food Marketing System, 2002, ERS-USDA
Primary Commodities Under Contract • Sugar Cane • Market Eggs • Potatoes • Fresh Veg. • Hatching Eggs Production Contracts Ownership Integrated Marketing Contracts • Sugar Beets • Processed Veg. • Broilers • Hatch Eggs • Potatoes • Sugar Cane • Market Turkeys • Milk • Citrus Fruits • Other Fruits/Nuts • Dry Beans / Peas Source: U.S. Food Marketing System, 2002, ERS-USDA
Concentration Continues:Top Four Firm Market Share Source: U.S. Food Marketing System, 2002, ERS-USDA
Mergers and Acquisitions http://www.newint.org/issue172/facts.htm http://en.wikipedia.org/wiki/Philip_Morris http://money.cnn.com/magazines/fortune/fortune500/snapshots/562.html http://www.kelloggcompany.com/kelloggco/our_company/index.html Source: U.S. Food Marketing System, 2002, ERS-USDA
Number of Acquisitions / Divestures Source: U.S. Food Marketing System, 2002, ERS-USDA
New Food Products Introduced into Market Source: U.S. Food Marketing System, 2002, ERS-USDA
Type of Nutritional Claims Source: U.S. Food Marketing System, 2002, ERS-USDA
Relationship between Coupon Distribution and Redemption Source: U.S. Food Marketing System, 2002, ERS-USDA
Imports, Exports and FDI Source: U.S. Food Marketing System, 2002, ERS-USDA
Other Manufacturing Changes • Total Employment slightly growing in food processing industry • Meat Processing accounts for 30% • Fruit and Veg. Processing accounts for 13% • Bakery Products 12% • Cost of Inputs Decreases between 1997-2000 • 12% Less for crude foodstuffs • 4 % Less for intermediate materials (packaging, etc.) Source: U.S. Food Marketing System, 2002, ERS-USDA
Summary! • Total U.S. Food Manufacturing accounts for about 2% of GDP, the total food and fiber system is about 12% of GDP. • Proportion of disposable income spent on food continues to drop while total value of all processed food shipments remains relatively flat. • Concentration in the food processing sector has increased. • New food products introduced into the market have declined since 1995. • Those new food products that have been introduced focus on specific nutritional / health claims. • Food coupon redemption rates are very low. • Trade deficit in U.S. Food Manufacturing grows. Source: U.S. Food Marketing System, 2002, ERS-USDA