Download
1 / 17
170 likes | 341 Vues
Sorbitol is the world’s most consumed polyol and widely used in the production of toothpastes, toiletries, cosmetics, confectionaries, sweets, frozen desserts, biscuits, ascorbic acid, industrial surfactants, pharmaceuticals, healthcare products and various other industrial product. In this study you will read about its all factors that will help entrepreneurs and stakeholders to increase their understanding and prepare for a make investment decision in sorbitol industry. Read full report here: http://www.imarcgroup.com/global-sorbitol-glucitol-market

E N D
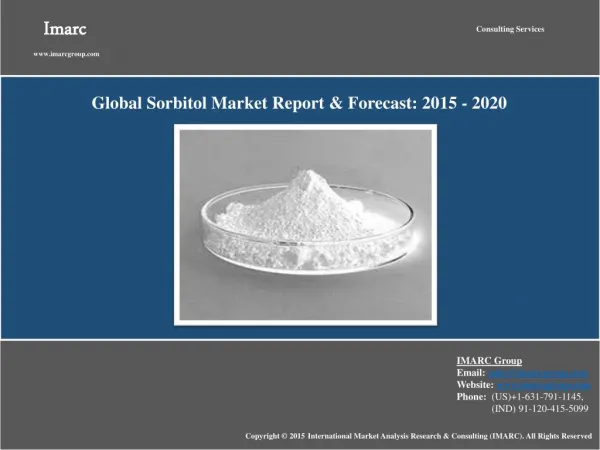
Imarc Imarc www.imarcgroup.com Consulting Services Global Sorbitol Market Report & Forecast: 2015 - 2020 IMARC Group Email: sales@imarcgroup.com Website: www.imarcgroup.com Phone: (US)+1-631-791-1145, (IND) 91-120-415-5099 Copyright © 2015 International Market Analysis Research & Consulting (IMARC). All Rights Reserved
Imarc Imarc www.imarcgroup.com Report DescriptionAbout IMARC Group The International Market Analysis Research and Consulting Group is a leading advisor on management strategy and market research worldwide. We partner with clients in all sectors and regions to identify their highest-value opportunities, address their most critical challenges, and transform their businesses. IMARC’s information products include major market, scientific, economic and technological developments for business leaders in pharmaceutical, industrial, and high technology organizations. Market forecasts and industry analysis for biotechnology, advanced materials, pharmaceuticals, food and beverage, travel and tourism, nanotechnology and novel processing methods are at the top of the company’s expertise. IMARC’s tailored approach combines unfathomable insight into the dynamics of companies and markets with close cooperation at all levels of the client organization. This ensures that our clients achieve unmatchable competitive advantage, build more proficient organizations, and secure lasting results.
Imarc Imarc www.imarcgroup.com Report Description and Highlights Report Description New Report Analyses the Sorbitol Market and Discusses Its Market Structure, Applications, Manufacturing Process, Demand, Supply, Key Regions and Manufacturers Sorbitol currently represents the world’s most consumed polyol with its demand growing at 2%-3% annually. China is currently its largest producer followed by the United States and Western Europe. Sorbitol (also known as Glucitol) is a sugar alcohol or polyol. It was originally identified in the berries of a tree called the mountain ash, by a French chemist in 1872 and is presently produced commercially by the hydrogenation of glucose. Sorbitol currently represents the world’s most consumed polyol and finds applications across various industries. It is widely used in the production of toothpastes, toiletries, cosmetics, confectionaries, sweets, frozen desserts, biscuits, ascorbic acid, industrial surfactants, pharmaceuticals, healthcare products, etc. The global demand of Sorbitol is currently growing at 2%-3% annually with China being the world’s largest producer. China was followed by the United States and Western Europe. The feedstocks used to produce sorbitol can differ from region to region with corn, cassava and wheat currently being the three main feedstocks used for sorbitol production. The market is also quite concentrated in nature with the top 5 players presently accounting for more than 50% of the total global production capacity. Roquette, a French company is currently the world’s biggest producer of Sorbitol. IMARC’s new report entitled “Global Sorbitol Market Report & Forecast: 2015 - 2020” provides an analytical and statistical insight into the global sorbitol market. The study, that has been undertaken using desk-based as well as qualitative primary research, provides a comprehensive analysis of the global sorbitol market.
Imarc Imarc www.imarcgroup.com Report Description and Highlights Report Description What we have achieved in this report: Comprehensive situation analysis of the global sorbitol market and its dynamics Focus of the analysis: • Historical, current and future trends in production capacity • Historical, current and future trends in production • Historical, current and future trends in demand • Historical, current and future trends in prices • Demand by application sector • Production capacity by region • Production by region • Consumption by region • Production by type of feedstock (corn, wheat, cassava, etc.) • Key players and their production capacities • Sorbitol substitutes Evaluation of major regions Regions covered:China, United States, Western Europe, Indonesia and India Focus of the analysis for each region: • Historical, current and future trends in production capacity • Historical, current and future trends in production
Imarc Imarc www.imarcgroup.com Sorbitol Market Report Description
Imarc Imarc www.imarcgroup.com Report Description and Highlights Report Description • • • • Historical, current and future trends in demand Historical, current and future trends in prices Demand by application sector Production capacity by region Evaluation of various sorbitol feedstocks and manufacturing process Focus of the analysis: • Characteristics of various feedstocks used in sorbitol production • Yield of sorbitol and by-products from various feedstocks • Supply and demand of various feedstocks • Manufacturing process of sorbitol • Interchanging feedstocks Evaluation of major sorbitol manufacturers Manufacturers covered: Roquette Frères, Cargill, Ingredion, Archer Daniels Midland, Shandong Tianli, PT Sorini Focus of the analysis: • Company description • Sorbitol production capacity • Sorbitol production • Feedstocks used for sorbitol production • Plant locations
Imarc Imarc www.imarcgroup.com Report Description and Highlights Report Description Table of Contents 1. Research Methodology and Market Definitions 2. Executive Summary 3. The Global Sorbitol Industry: Market Landscape 3.1 Historical Market Trends 3.1.1 Production Capacity 3.1.2 Consumption 3.1.3 Prices 3.2 Market by Application Sector 3.3 Market by Region 3.3.1 Production Capacity 3.3.2 Production 3.3.3 Consumption 3.4 Market by Feedstock 3.5 Competitive Landscape 3.6 Sorbitol Substitutes 3.7 Market Forecast 3.7.1 Production Capacity 3.7.2 Consumption 3.7.3 Prices 4. The Global Sorbitol Industry: Regional Analysis 4.1 China 4.1.1 Sorbitol Production Capacity and Production
Imarc Imarc www.imarcgroup.com Report Description and Highlights Report Description 4.1.2 Sorbitol Consumption 4.1.3 Sorbitol Production Statistics from Various Feedstocks 4.1.4 Historical and Future Price Trends of Various Feedstocks 4.1.5 Historical and Future Cost of Manufacturing Sorbitol from Various Feedstocks 4.1.6 Competitive Landscape 4.2 United States 4.2.1 Sorbitol Production Capacity and Production 4.2.2 Sorbitol Consumption 4.2.3 Sorbitol Production Statistics from Various Feedstocks 4.2.4 Historical and Future Price Trends of Various Feedstocks 4.2.5 Historical and Future Cost of Manufacturing Sorbitol from Various Feedstocks 4.2.6 Competitive Landscape 4.3 Europe 4.3.1 Sorbitol Production Capacity and Production 4.3.2 Sorbitol Consumption 4.3.3 Sorbitol Production Statistics from Various Feedstocks 4.3.4 Historical and Future Price Trends of Various Feedstocks 4.3.5 Historical and Future Cost of Manufacturing Sorbitol from Various Feedstocks 4.3.6 Competitive Landscape 4.4 Indonesia 4.4.1 Sorbitol Production Capacity and Production 4.4.2 Sorbitol Consumption 4.4.3 Sorbitol Production Statistics from Various Feedstocks 4.4.4 Historical and Future Price Trends of Various Feedstocks
Imarc Imarc www.imarcgroup.com Report Description and Highlights Report Description 4.4.5 Historical and Future Cost of Manufacturing Sorbitol from Various Feedstocks 4.4.6 Competitive Landscape 4.5 India 4.5.1 Sorbitol Production Capacity and Production 4.5.2 Sorbitol Consumption 4.5.3 Sorbitol Production Statistics from Various Feedstocks 4.5.4 Historical and Future Price Trends of Various Feedstocks 4.5.5 Historical and Future Cost of Manufacturing Sorbitol from Various Feedstocks 4.5.6 Competitive Landscape 5. Sorbitol Manufacturing and Feedstock Analysis 5.1 Characteristics of Various Feedstocks Used in Sorbitol Production 5.2 Supply and Demand of Various Feedstocks 5.3 Manufacturing Process 5.3.1 Production of Starch Slurry Using Corn 5.3.2 Production of Starch Slurry Using Cassava 5.3.3 Production of Starch Slurry Using Wheat 5.3.4 Production of Glucose Syrup 5.3.5 Conversion of Glucose Syrup to Sorbitol 5.4 Interchanging Sorbitol Feedstocks 6. Competitive Landscape 6.1 Roquette Frères SA 6.2 Cargill, Incorporated 6.3 Ingredion, Incorporated 6.4 Archer Daniels Midland Company
Imarc Imarc www.imarcgroup.com Report Description and Highlights Report Description 6.5 Shandong Tianli Pharmaceutical Co., Ltd 6.6 Nikken Fine Chemicals Co., Ltd 6.7 PT Sorini Agro Asia Corporindo Tbk List of Figures Figure 1: Global: Sorbitol Production Capacity (in 000 Mt), 2007-2014 Figure 2: Global: Sorbitol Prices (in US$/Mt), 2007 -2014 Figure 3: Global: Sorbitol Volume Demand (in 000 Mt), 2007-2014 Figure 4: Global: Sorbitol Value Demand (in Million US$), 2007-2014 Figure 5: Global: Sorbitol Volume Demand by Consuming Sectors (in %), 2014 Figure 6: Global: Sorbitol Production Capacity by Key Producer Countries (in %), 2007, 2014 & 2020 Figure 7: Global: Sorbitol Production by Key Producer Countries (in %), 2007, 2014 & 2020 Figure 8: Global: Sorbitol Volume Demand by Region (in %), 2007, 2014 & 2020 Figure 9: Global: Sorbitol Production by Feedstock (in %), 2014 Figure 10: Global: Sorbitol Production Capacity Breakup by Manufacturers (in %) Figure 11: Global: Sorbitol Production Capacity Forecast (in 000 Mt), 2015-2020 Figure 12: Global: Sorbitol Volume Demand Forecast (in 000 Mt), 2015-2020 Figure 13: Global: Sorbitol Price Forecast (in US$/Metric Ton), 2015-2020 Figure 14: Global: Sorbitol Value Demand Forecast (in Million US$), 2015-2020 Figure 15: China: Sorbitol Production Capacity (in 000 Mt), 2007, 2014 & 2020 Figure 16: China: Sorbitol Production (in 000 Mt), 2007, 2014 & 2020 Figure 17: China: Sorbitol Demand (in 000 Mt), 2007, 2014 & 2020 Figure 18: China: Sorbitol Production by Feedstock (in %), 2014
Imarc Imarc www.imarcgroup.com Report Description and Highlights Report Description Figure 19: China: Corn Prices (in US$ /Mt), 2009 -2014 Figure 20: China Wheat Prices (in US$ /MT), 2009 -2014 Figure 21: China: Cassava Prices (in US$ /Mt), 2009 -2014 Figure 22: China: Corn, Wheat & Cassava Prices (in US$ Per Mt), 2009 -2014 Figure 23: China: Sorbitol Production Costs From Various Feedstocks (in US$ Per Mt) Figure 24: China Sorbitol Production Capacity Breakup by Manufacturers (in %) Figure 25: United States: Sorbitol Production Capacity (in 000 Mt), 2007, 2014 & 2020 Figure 26: United States: Sorbitol Production (in 000 Mt), 2007, 2014 & 2020 Figure 27: United States: Sorbitol Demand (in 000 Mt), 2007, 2014 & 2020 Figure 28: United States: Wheat Prices (in US$ /Mt), 2009 - 2014 Figure 29: United States: Corn Prices (in US$ /Mt), 2009 - 2014 Figure 30: United States: Corn & Wheat Prices (in US$ Per Mt), 2009 - 2014 Figure 31: United States: Sorbitol Production Costs (in US$ Per Mt) Figure 32: United States Sorbitol Production Capacity by Manufacturers (in %) Figure 33: Western Europe: Sorbitol Production Capacity (in 000 Mt), 2007, 2014 & 2020 Figure 34: Western Europe: Sorbitol Production (in 000 Mt), 2007, 2014 & 2020 Figure 35: Western Europe: Sorbitol Demand (in 000 Mt), 2007, 2014 & 2020 Figure 36: Western Europe: Sorbitol Production by Feedstock (in %), 2014 Figure 37: France: Wheat Prices (in US$ /Mt), 2009-2014 Figure 38: France: Corn Prices (in US$ /Mt), 2009-2014 Figure 39: France: Corn & Wheat Prices (in US$ Per Mt) 2009-2014 Figure 40: France: Sorbitol Production Costs From Corn & Wheat (in US$ Per Mt) Figure 41: Western Europe: Sorbitol Production Capacity by Key Producers (in %) Figure 42: Indonesia: Sorbitol Production Capacity (in 000 Mt), 2007, 2014 & 2020
Imarc Imarc www.imarcgroup.com Report Description and Highlights Report Description Figure 43: Indonesia: Sorbitol Production (in 000 Mt), 2007, 2014 & 2020 Figure 44: Indonesia: Sorbitol Demand (in 000 Mt), 2007, 2014 & 2020 Figure 45: Indonesia: Sorbitol Production by Feedstock (in %), 2014 Figure 46: Indonesia: Cassava Prices (in US$ /Mt), 2009-2014 Figure 47: Indonesia: Corn Prices (in US$ /Mt), 2009-2014 Figure 48: Indonesia: Corn & Cassava Prices (in US$ Per Mt), 2009-2014 Figure 49: Indonesia: Sorbitol Production Costs From Corn & Cassava (in US$ Per Mt) Figure 50: Indonesia: Sorbitol Production by Key Producers (in %), 2014 Figure 51: India: Sorbitol Production Capacity (in 000 Mt), 2007, 2014 & 2020 Figure 52: India: Sorbitol Production (in 000 Mt), 2007, 2014 & 2020 Figure 53: India: Sorbitol Demand (in 000 Mt), 2007, 2014 & 2020 Figure 54: India: Cassava Prices (in US$ /Mt), 2009-2014 Figure 55: India: Wheat Prices (in US$ /Mt), 2009-2014 Figure 56: India: Corn Prices (in US$ /Mt), 2009-2014 Figure 57: India: Corn, Wheat & Cassava Prices (in US$ Per Mt), 2009-2014 Figure 58: India: Sorbitol Production Costs From Corn, Wheat & Cassava (in US$ Per Mt) Figure 59: India: Sorbitol Production by Key Producers (in %) Figure 60: Sorbitol and By-Product Conversion Rates from Corn, Wheat and Cassava Figure 61: Global: Corn Supply & Demand (in Million Mt), 2007 -2014 Figure 62: Global: Corn Production by Country (in %), 2014 Figure 63: Global: Wheat Supply & Demand (in Million Mt), 2007 – 2014 Figure 64: Global: Wheat Production by Country (in %), 2014 Figure 65: Global: Cassava Production (in Million Mt), 2007 -2014 Figure 66: Global: Cassava Production by Country (in %), 2014
Imarc Imarc www.imarcgroup.com Report Description and Highlights Report Description Figure 67: Sorbitol Manufacturing Process Figure 68: Production of Starch Slurry Using Corn Figure 69: Production of Starch Slurry Using Wheat Figure 70: Production of Starch Slurry Using Cassava Figure 71: Production of Glucose Syrup from Starch Slurry Figure 72: Conversion of Glucose Syrup to Sorbitol Figure 73: Interchanging Sorbitol Feedstocks Figure 74: Roquette Frères SA: Production Breakup by Product Figure 75: Shandong Tianli Pharmaceutical Co Limited: Capacity Breakup by Product Figure 76: PT Sorini Agro Asia Corporindo Tbk: Production Capacity of Various Products (in Mt), Figure 77: PT Sorini Agro Asia Corporindo Tbk: Production Capacity of Various Products (in %), List of Tables Table 1: Global: Sorbitol Production Capacity by Key Producer Countries (in 000 Mt), 2007, 2014 & 2020 Table 2: Global: Sorbitol Production by Key Producer Countries (in 000 Mt), 2007, 2014 & 2020 Table 3: Global: Sorbitol Volume Demand by Region (in 000 Mt), 2007, 2014 & 2020 Table 4: Global: Sorbitol Feedstock Statistics (in Mt), 2014 Table 5: Global: Sorbitol Production Capacity Breakup by Manufacturers (in Mt) Table 6: Characteristics of Various Polyols Table 7: China: Sorbitol Feedstock Statistics (in Mt) Table 8: China: Sorbitol Production Capacity Breakup by Manufacturers (in Mt) Table 9: United States: Sorbitol Feedstock Statistics (in Mt) Table 10: United States: Sorbitol Production Capacity by Manufacturers (in Mt)
Imarc Imarc www.imarcgroup.com Report Description and Highlights Report Description Table 11: Western Europe: Sorbitol Feedstock Statistics (in Mt) Table 12: Western Europe: Sorbitol Production Capacity Statistics by Key Producers (in Mt) Table 13: Indonesia: Sorbitol Feedstock Statistics (in Mt) Table 14: Indonesia: Sorbitol Production Statistics by Key Producers (in Mt) Table 15: India: Sorbitol Feedstock Statistics (in Mt) Table 16: India: Sorbitol Production Statistics by Key Producers (in Mt) Table 17: *Price of Various Sorbitol By-products Table 18: Roquette Frères SA: Sorbitol Production Capacity, Production, Capacity Utilization, Feedstocks & Plant Locations Table 19: Roquette Frères SA: Product Overview Table 20: Cargill, Incorporated: Sorbitol Production Capacity, Production, Capacity Utilization, Feedstocks & Plant Locations Table 21: Ingredion Incorporated: Sorbitol Production Capacity, Production, Capacity Utilization, Feedstocks & Plant Locations Table 22: Archer Daniels Midland Company: Sorbitol Production Capacity, Production, Capacity Utilization, Feedstocks & Plant Locations Table 23: Shandong Tianli Pharmaceutical Co Limited: Sorbitol Production Capacity, Production, Capacity Utilization, Feedstocks & Plant Locations Table 24: PT Sorini Agro Asia Corporindo Tbk: Sorbitol Production Capacity, Production, Capacity Utilization, Feedstocks & Plant Locations
Imarc Imarc www.imarcgroup.com Report Description and Highlights Report Description To buy the complete report or to get a free sample, please contact: IMARC Group Asia: Email: apac@imarcgroup.com Phone: +91-120-415-5099 IMARC Group North America: Email: america@imarcgroup.com Phone: +1-631-791-1145 IMARC Group Europe, Middle East & Africa: Email: ema@imarcgroup.com Phone: +44-702-409-7331 To know more please visit: http://www.imarcgroup.com/global-sorbitol-glucitol-market
Imarc Imarc www.imarcgroup.com Report Description and Highlights Report Description © 2015 IMARC All Rights Reserved This Publication and all it’s contents unless otherwise mentioned are copyrighted in the name of International Market Analysis Research and Consulting (IMARC). No part of this publication may be reproduced, repackaged, redistributed or resold in whole or in any part. The publication may also not be used in any form or by and means graphic electronic or mechanical, including photocopying, recording, taping or by information storage or retrieval, or by any other form, without the express consent of International Market Analysis Research and Consulting (IMARC). Disclaimer: All contents and data of this publication, including forecasts, data analysis and opinion have been based on information and sources believed to be accurate and reliable at the time of publishing. International Market Analysis Research and Consulting makes no representation of warranty of any kind as to the accuracy or completeness of any Information provided. IMARC accepts no liability whatsoever for any loss or damage resulting from opinion, errors or inaccuracies if any found this publication. IMARC, IMARC Group and Global Therapy Insight Series are registered trademarks of International Market Analysis Research and Consulting. All other trademarks used in this publication are registered trademarks of their respective companies.
Contact Us FOR MORE DETAILS Visit us at : http://www.imarcgroup.com Stay With Us: TELEPHONE: +91-120-4155099 E-MAIL: sales@imarcgroup.com
![Precision Irrigation Market Report [2015 - 2020]](https://cdn4.slideserve.com/7257265/slide1-dt.jpg)