Download
1 / 4
40 likes | 657 Vues
2000 $802B iShares exchange-traded funds. CoreActive fixed income ... Returns for funds with longest histories: US Alpha Tilts

E N D
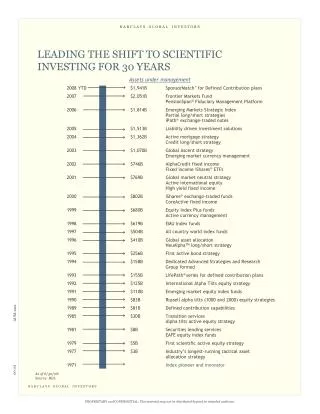
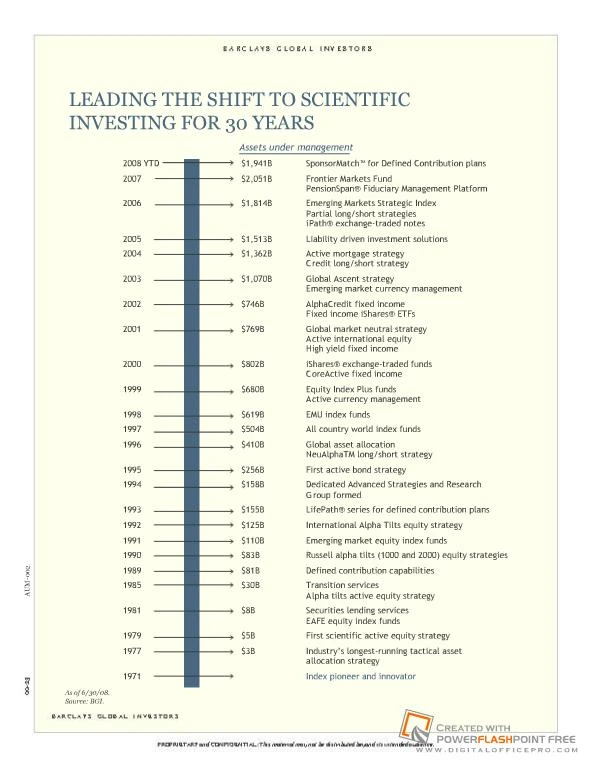
Slide 1:LEADING THE SHIFT TO SCIENTIFIC INVESTING FOR 30 YEARS
AUM-002 As of 6/30/08. Source: BGI. Assets under management BGI�s Alpha Tilts is an enhanced index strategy designed to outperform the S&P 500 index by 1-2% per year with an active risk of 2% or less. Alpha Tilts seeks to capture systematic return by exploiting market inefficiencies which are undiscovered or ignored by many investors, due to their subtlety, complexity, and size relative to the transaction costs that must be incurred to exploit them. The result is a diversified portfolio of large cap U.S. equities with many small overweight or underweight positions or �bets�, unlike the concentrated portfolios of traditional active managers. In addition, the Alpha Tilts strategy has been specifically designed to be style-neutral relative to the benchmark. Alpha is generated only through security selection, not through style, sector, or market timing bets. As a result of our portfolio optimization approach the portfolio demonstrates index-like risk characteristics with a higher expected return than the benchmark. BGI�s Alpha Tilts is an enhanced index strategy designed to outperform the S&P 500 index by 1-2% per year with an active risk of 2% or less. Alpha Tilts seeks to capture systematic return by exploiting market inefficiencies which are undiscovered or ignored by many investors, due to their subtlety, complexity, and size relative to the transaction costs that must be incurred to exploit them. The result is a diversified portfolio of large cap U.S. equities with many small overweight or underweight positions or �bets�, unlike the concentrated portfolios of traditional active managers. In addition, the Alpha Tilts strategy has been specifically designed to be style-neutral relative to the benchmark. Alpha is generated only through security selection, not through style, sector, or market timing bets. As a result of our portfolio optimization approach the portfolio demonstrates index-like risk characteristics with a higher expected return than the benchmark.
Slide 2:EVIDENCE THAT SKILLFUL ACTIVE MANAGEMENT IS POSSIBLE
Statistical evidence of Performance tenure Annualized Information skill vs. luck: Alpha strategies through 6/30/08 alpha % ratio T-stat* Alpha Tilts** 22 yrs, 10 mos 0.93 0.50 2.15 Russell 3000 Alpha Tilts** 17 yrs, 10 mos 1.16 0.66 2.60 Russell 1000 Alpha Tilts** 17 yrs, 10 mos 1.03 0.56 2.22 Russell 2000 Alpha Tilts** 18 yrs, 0 mos 2.54 0.78 2.87 Russell 1000 Value Alpha Tilts** 12 yrs, 4 mos 0.58 0.34 1.16 Russell 2000 Value Alpha Tilts** 12 yrs, 3 mos 1.24 0.34 1.07 Extended Alpha Tilts 12 yrs, 3 mos 2.11 0.66 1.99 International Alpha Tilts� 16 yrs, 3 mos 1.27 0.90 3.19 Europe ex-UK Alpha Tilts** 16 yrs, 4 mos 2.39 1.08 3.72 UK Alpha Tilts** 16 yrs, 4 mos 0.38 0.24 0.86 Japan Alpha Tilts** 20 yrs, 0 mos 0.49 0.20 1.09 Advanced Active Canadian Equity 10 yrs, 10 mos 2.32 1.33 3.98 Global Market Neutral 7 yrs, 4 mos 4.31 1.72 4.33 Active International Equity 7 yrs, 1 mo 2.34 0.92 2.24 CoreActive Bond 8 yrs, 6 mos 0.13 0.23 0.59 CorePlus Bond 6 yrs, 9 mos 0.94 0.74 1.79 Active High Yield 6 yrs, 9 mos 0.96 0.66 1.49 Return-Perf-203 * Monthly alpha used in the calculation of the t-statistic. ** Returns for funds with longest histories: US Alpha Tilts �A� series, Japan Alpha Tilts �B�, Europe ex-UK Alpha Tilts �A�, UK Alpha Tilts separate account. � Strategy calculated using capitalization-weighted Japan Tilts, UK Tilts and Europe ex-UK Tilts �A� funds and Pacific ex-Japan Index Fund returns through 1/31/96. International Alpha Tilts Fund returns thereafter. Returns as of 6/30/08. Sources: BGI, Frank Russell Company, MSCI, Standard & Poor�s, TSE 300 Index.
Slide 3:ACTIVE STRATEGIES The world of Barclays Global Investors
LONG-ONLY ACTIVE EQUITY US Strategies Alpha Tilts Extended Alpha Tilts Mid Cap Alpha Tilts Russell 1000 Alpha Tilts Russell 2000 Alpha Tilts Russell 3000 Alpha Tilts Russell 1000 Value Alpha Tilts Russell 2000 Value Alpha Tilts Russell 1000 Growth Alpha Tilts Russell 2000 Growth Alpha Tilts Russell 3000 Growth Alpha Tilts International Strategies Active International Equity Global Market Insights Global ex-US Alpha Tilts International Alpha Tilts World Alpha Tilts World ex-US Alpha Tilts Index Plus Strategies Global ex-US Index Plus Index Plus (S&P 500, Russell 1000) World ex-US Index Plus LONG-ONLY ACTIVE FIXED INCOME US & International Strategies AlphaCredit High Yield AlphaCredit Investment Grade Alpha Emerging Markets Bond Alpha Government Bond Alpha Mortgage Bond CoreActive Bond CoreActive LIBOR CoreAlpha Bond CorePlus Bond Synthetic Core Bond LONG/SHORT Partial Long/Short Strategies Alpha Advantage 500 (S&P 500) Alpha Advantage 1000 (Russell 1000) Alpha Advantage 3000 (Russell 3000) Partial Long/Short Strategies (cont.) Alpha Advantage Europe (MSCI Europe) Alpha Advantage International (MSCI EAFE) Alpha Advantage Japan (MSCI Japan) Alpha Advantage World (MSCI World) Asia Alpha Advantage (MSCI AC Asia ex-Japan) US Alpha Advantage (MSCI US) Global Market Strategies BGI managed fund of internal hedge funds Credit long/short External Manager Selection strategy Global Macro long/short Global Market Neutral Global Fixed Income long/short Rates long/short GLOBAL MARKETS Active Currency Dynamic Currency Hedging LifePath� Portfolios LifePath� Retirement LifePath 2010� LifePath 2015� LifePath 2020� LifePath 2025� LifePath 2030� LifePath 2035� LifePath 2040� LifePath 2045� LifePath 2050�* TRADING Rebalancing Strategies Social-Purpose Divestment/Reinvestment Transition Services Temporary Beta Cash Cash Plus Core LIBOR Custom Strategies Money Market 00-23-024 * LifePath 2050 will be available 1/1/2008. As of 9/30/07.
GLOBAL ORGANIZATION Barclays Global Investors AUM-004 * Excluding contractors. As of 3/31/08. Source: BGI. Toronto AUM $59.1B Clients 165 Staff 73 London AUM $506.9B Clients 1,143 Staff 1,094 Amsterdam AUM $77.1B Clients 102 Staff 9 Tokyo AUM $182.4B Clients 290 Staff 262 Sydney AUM $38.3B Clients 349 Staff 184 Montreal AUM $5.9B Clients 37 Staff 5 Boston AUM $30.8B Clients 63 Staff 11 HK/Singapore AUM $12.9B Clients 22 Staff 62Slide 4:80 years investment experience, originally as part of Wells Fargo Bank. Now, majority-owned subsidiary of Barclays with substantial employee ownership. Total assets managed: $1,968.5 billion Total active assets managed: $398.7 billion 3,537 employees worldwide* serving approximately 2,964 clients in 52 countries Hedge fund assets: $25.3 billion of invested client assets 5th largest hedge fund manager � Bloomberg Magazine 2007 �Transition Manager of the Year� � Global Investor 2006 �Asset Manager of the Year� � Risk Magazine January 2008 #1 Global Asset Manager � Global Investor December 2007 #1 Global Index Manager � Pensions & Investments September 2007 #1 Global ETF Manager � Morgan Stanley Research November 2007
Latin America AUM $19.9B Clients 32 Staff 15 San Francisco AUM $1,008.3B Clients 747 Staff 1,812 Atlanta AUM $26.8B Clients 14 Staff 4