Download
1 / 79

E N D
10-1 Food Webs and Trophic Dynamics An ecosystem is the totality of the environment encompassing all chemical, physical, geological and biological parts. • Ecosystems function by the exchange of matter and energy. • Plants use chlorophyll in photosynthesis to convert inorganic material into organic compounds and to store energy for growth and reproduction. • Plants are autotrophs and the primary producers in most ecosystems. • All other organisms are heterotrophs, the consumers and decomposers in ecosystems. • Herbivores eat plants and release the stored energy.
10-1 Food Webs and Trophic Dynamics • Population size is dependent upon food supply. • Material is constantly recycled in the ecosystem, but energy gradually dissipates as heat and is lost.
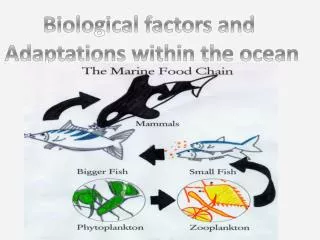
10-1 Food Webs and Trophic Dynamics The word “trophic” refers to nutrition. • Trophic dynamics is the study of the nutritional interconnections among organisms within an ecosystem. • Trophic level is the position of an organism within the trophic dynamics. • Autotrophs form the first trophic level. • Herbivores are the second trophic level. • Carnivores occupy the third and higher trophic levels. • Decomposers form the terminal level. • A food chain is the succession of organisms within an ecosystem based upon trophic dynamics. (Who is eaten by whom.)
10-1 Food Webs and Trophic Dynamics • An energy pyramid is the graphic representation of a food chain in terms of the energy contained at each trophic level. • The size of each successive level is controlled by the size of the level immediately below.
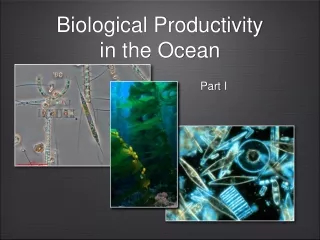
10-1 Food Webs and Trophic Dynamics As the primary producers, plants require sunlight, nutrients, water and carbon dioxide for photosynthesis. • Sunlight and nutrients are commonly the limiting factor. • The formula for photosynthesis is: • Sunlight + 6 CO2 + 6 H2O C6H12O6 (sugar) + 6 O2. • Phytoplankton blooms are the rapid expansion of a phytoplankton population because light and nutrients are abundant.
10-1 Food Webs and Trophic Dynamics Bacteria are the decomposers; they break down organic material and release nutrients for recycling. • Few bacteria are capable of completely degrading organic material into its inorganic components. Most operate in succession with other bacteria to decompose material in a series of stages. • Bacteria also serve as food for other organisms either directly or indirectly. • Two basic types of bacteria are Aerobic bacteria and Anaerobic bacteria. • Most bacteria are heterotrophs, but two types are autotrophs: Cyanobacteria (blue-green algae) and Chemosynthetic bacteria.
10-1 Food Webs and Trophic Dynamics Animals must consume pre-existing organic material to survive. • Animals break down the organic compounds into their inorganic components to obtain the stored energy. • The chemical formula for respiration is: • C6H12O6 (sugar) + 6 O2 6 CO2 + 6 H2O + Energy. • The recovered energy is used for movement, reproduction and growth. • The food consumed by most organisms is proportional to their body size. • Generally, smaller animals eat smaller food and larger animals eat larger food, although exceptions occur. • The basic feeding style of animals are: Grazers, Predators, Scavengers, Filter feeders, and Deposit feeders.
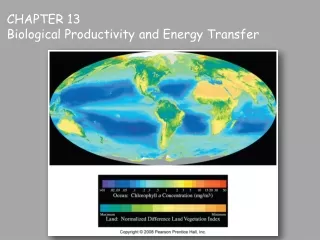
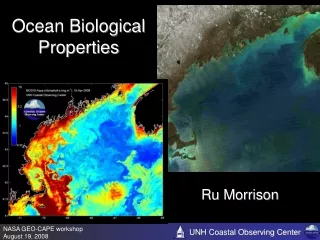
10-2 General Marine Productivity Primary production is the total amount of carbon (C) in grams converted into organic material per square meter of sea surface per year (gm C/m2/yr). • Factors that limit plant growth and reduce primary production include solar radiation and nutrients as major factors and upwelling, turbulence, grazing intensity and turbidity as secondary factors. • Only .1 to .2% of the solar radiation is employed for photosynthesis and its energy stored in organic compounds. • Macronutrients and Micronutrients are chemicals needed for survival, growth and reproduction.
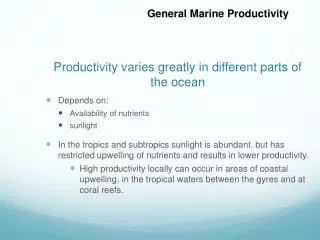
10-2 General Marine Productivity Productivity varies greatly in different parts of the ocean in response to the availability of nutrients and sunlight. • In the tropics and subtropics sunlight is abundant, but it generates a strong thermocline that restricts upwelling of nutrients and results in lower productivity. • High productivity locally can occur in areas of coastal upwelling, in the tropical waters between the gyres and at coral reefs. • In temperate regions productivity is distinctly seasonal. • Polar waters are nutrient-rich all year but productivity is only high in the summer when light is abundant.
10-2 General Marine Productivity • Upwelling and turbulence can return nutrients to the surface. • Over-grazing of autotrophs can deplete the population and lead to a decline in productivity. • Turbidity reduces the depth of light penetration and restricts productivity even if nutrients are abundant.
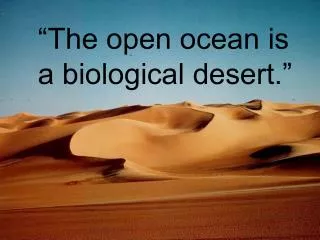
10-3 Global Patterns of Productivity Primary productivity varies from 25 to 1250 gm C/m2/yr in the marine environment and is highest in estuaries and lowest in the open ocean. • In the open ocean productivity distribution resembles a “bull’s eye “ pattern with lowest productivity in the center and highest at the edge of the basin. • Water in the center of the ocean is a clear blue because it is an area of downwelling, above a strong thermocline and is almost devoid of biological activity. • Continental shelves display moderate productivity between 50 and 200 gm C/m2/yr because nutrients wash in from the land and tide- and wave- generated turbulence recycle nutrients from the bottom water.
10-3 Global Patterns of Productivity • Polar areas have high productivity because there is no pycnocline to inhibit mixing. • Equatorial waters have high productivity because of upwelling.
10-1 Food Webs and Trophic Dynamics Food chains transfer energy from one trophic level to another. • Biomass is the quantity of living matter per volume of water. • With each higher trophic level, the size of organisms generally increases, but their reproductive rate, number and the total biomass decrease. • The two major food chains in the ocean are the Grazing food chain and the Detritus food chain - non-living wastes form the base of the food chain. • Only about 10-20% of energy is transferred between trophic levels and this produces a rapid decline in biomass at each successive trophic level.
10-3 Global Patterns of Productivity It is possible to estimate plant and fish productivity in the ocean. • The size of the plankton biomass is a good indicator of the biomass of the remainder of the food web. • Annual primary production (APP) is equal to primary production rate (PPR) times the area for which the rate is applicable. • APP = PPR x Area (to which applicable ) • Transfer efficiency (TE) is a measure of the amount of carbon that is passed between trophic levels and is used for growth. • Transfer efficiency varies from 10 to 20% in most food chains.
10-3 Global Patterns of Productivity • Potential production (PP) at any trophic level is equal to the annual primary production (APP) times the transfer efficiency (TE) for each step in the food chain to the trophic level of the organism under consideration. • PP = APP x TE (for each step) • Although rate of productivity is very low for the open ocean compared to areas of upwelling, the open ocean has the greatest biomass productivity because of its enormous size. • In the open ocean the food chains are longer and energy transfer is low, so fish populations are small. • Most fish production is equally divided between area of upwelling and coastal waters. • Calculations suggest that the annual fish production is about 240 million tons/yr.
10-3 Global Patterns of Productivity • Over-fishing is removing fish from the ocean faster than they are replaced by reproduction and this can eventually lead to the collapse of the fish population.
10-4 Biological Productivity of Upwelling Water Upwelling of deep, nutrient-rich water supports large populations of phytoplankton and fish. • The waters off the coast of Peru normally is an area of upwelling, supporting one of the world’s largest fisheries. • Every three to seven years warm surface waters in the Pacific displace the cold, nutrient-rich water on Peru’s shelf in a phenomenon called El Nino. • El Nino results in a major change in fauna on the shelf and a great reduction in fishes. • This can lead to mass starvation of organisms dependent upon the fish as their major food source.