Download
1 / 28

E N D
World and U.S Wheat Markets Dr. Vincent H. Smith Department of Agricultural Economics and Economics Montana State University Follow the Grain: March 25, 2009
Outline • A Long Run Perspective on World Wheat Markets • The Changing Structure of World Wheat Markets • Competitors and Customers in Export Markets • Trade Policy Issues
World Wheat Market Structure Production is spread over many countries World Exports Concentrated among the “Big Five” (Argentina, Australia, Canada, European Union, United States) plus India. World imports are spread among many countries.
Country Specific Trends • United States • Canada • European Union • Australia • Argentina • India • China • Former Soviet Union
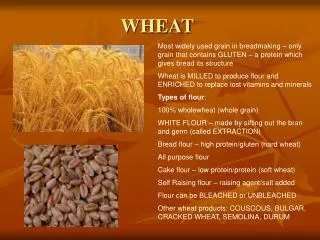
Wheat Market Basics World production generally drives average world prices, although corn prices have also been important in recent years World production was large in 2009 because of strong per acre yields and very high prices in early 2009. World Production was low in 1996 (about 521 million tons) and prices were at 20 year highs. A somewhat, but not completely, different story in 2010. US Wheat Demand has recently shrunk, partly because millers are adopting technologies to increase flour yield per ton of wheat in response to high prices
Government Payments • Counter Cyclical Payments • Loan Deficiency and Direct Payments • The New ACRE Program • Crop Insurance Subsidies • CRP payments
Trade Issues • Orange Box: - Subsidies linked to current production or prices • Blue Box - Subsidies tied to historical production that may affect some current production decisions • Green Box - Subsidies viewed as not affecting current production (decoupled payments, etc)
Recent Trade Development The Brazilian Cotton Case Findings: - U.S. direct payments were not decoupled - Countercylcical payments were orange box and payments and therefore GATT illegal - The step 2 program for cotton was a GATT illegal export subsidy - Modest increases in the loan rate for cotton had caused “price depression.” Economists would agree about the step 2 program but are skeptical about the WTO panel conclusions with respect to direct payments. New WTO cases are being brought. Several major US subsidy programs now violate US WTO obligations
Questions???? Questions???? Questions!! Questions?????